Customer churn prediction is all about using data to get ahead of cancellations.Think of it as an early warning system for your subscription business. It shifts you from scrambling to react when a customer leaves to proactively saving at-risk accounts before they even think about hitting the "cancel" button.
What Is Customer Churn Prediction and Why It Matters

Imagine trying to steer a ship by only looking at the wake behind it. That’s what managing a subscription business without churn prediction feels like. You only see the problems after the customers are gone.
Customer churn prediction completely flips this around. It’s a smart, data-driven approach that digs into user behavior, payment history, and support tickets to flag which customers are likely to leave soon.
Instead of waiting for that dreaded cancellation email to land in your inbox, you can catch the subtle signs of disengagement early. This insight gives you a golden opportunity to step in with targeted support, a personalized offer, or helpful resources that remind them why they signed up in the first place. It’s the difference between damage control and genuine, strategic retention.
The Business Case for Predicting Churn
For any company running on subscriptions, especially in the SaaS world, keeping the customers you have is always cheaper and more effective than finding new ones. It's a simple truth. A high churn rate is a silent killer, slowly eating away at your monthly recurring revenue (MRR) and bringing growth to a grinding halt.
Customer churn prediction isn’t just a defensive move; it’s a core growth strategy. By identifying at-risk accounts, you protect your revenue base, allowing your acquisition efforts to contribute to genuine expansion rather than just backfilling the holes left by lost customers.
This proactive mindset fundamentally changes how your teams work. Your customer success team, for example, can shift from being reactive problem-solvers to proactive value-drivers. With a reliable churn prediction system in place, you can:
- Prioritize outreach efforts by focusing your team’s precious time on the accounts that need attention right now.
- Personalize retention campaigns by tailoring your message based on the specific signals a customer is showing. Are they not using a key feature? Did they have a bad support experience?
- Improve your product by spotting common pain points and usage patterns that consistently lead to churn.
To put these ideas into a clear framework, let's break down the core concepts.
Core Concepts in Churn Prediction at a Glance
This table sums up the fundamental ideas behind churn prediction and why they are so crucial for your business's health and growth.
| Concept | What It Means | Why It's Important for Your Business |
|---|---|---|
| Churn Rate | The percentage of customers who cancel their subscription over a specific period. | It's the primary health metric for a subscription business. A high rate erodes revenue and stalls growth. |
| Prediction Window | The timeframe for your forecast (e.g., predicting churn in the next 7, 14, or 30 days). | It determines how much lead time you have to intervene and save an at-risk customer. |
| Churn Signals | Behaviors or data points that indicate a customer is likely to churn (e.g., low usage). | These are the "red flags" your model looks for. Identifying the right signals is key to accuracy. |
| Retention Intervention | The specific action you take to prevent a predicted churn (e.g., an email or offer). | This is where prediction turns into action. Without effective interventions, the forecast is useless. |
By internalizing these concepts, you can move from simply tracking churn to actively preventing it, which is the ultimate goal.
Understanding Industry Churn Benchmarks
While every business hates churn, the "normal" rate can look very different depending on your industry. The global average churn rate is around 21%, but some sectors feel the burn more than others. Retail sees rates as high as 25.4%, and telecom isn't far behind at 21.5%.
On the other hand, banking and healthcare generally enjoy lower churn. The good news? Businesses that adopt data-driven tools for customer churn prediction have seen their churn rates drop by up to 30% simply by engaging at-risk customers before it's too late. You can dive deeper into these industry benchmarks and trends at Growth-onomics.
Ultimately, predicting churn gives you the foresight to build a more resilient and profitable business. It’s about turning your customer data into your most valuable retention asset.
The Data That Fuels Accurate Churn Predictions
A churn prediction model is a bit like a high-performance engine—the power you get out is a direct result of the fuel you put in. For your model, that fuel is data. If you feed it messy, incomplete, or irrelevant information, even the most sophisticated algorithm will sputter and stall, leaving you with guesses instead of actionable insights.
The whole game starts with collecting the right data. It's not about hoarding every byte of information you can find, but about zeroing in on the specific signals that tell you how healthy a customer relationship really is. These signals typically fall into a few key categories, and each one gives you a different piece of the puzzle.
By weaving these different data sources together, you stop looking at isolated metrics and start seeing the full story behind each customer account. This holistic view is what separates a decent churn prediction model from a great one.
Behavioral and Product Usage Data
Honestly, how people use your product is probably the single biggest tell. When you see engagement start to dip, that’s your classic canary in the coal mine—it’s a clear sign that a user isn't getting the value they once did. The trick is to spot this disengagement early, long before they start thinking about canceling.
Think about it: a customer who logs in every day and lives inside your core features is deeply invested. On the other hand, a user whose logins become less frequent and who sticks to superficial features is basically just window shopping. Your job is to measure these subtle but critical shifts in behavior.
Here are the bread-and-butter metrics to track:
- Login Frequency: How often is a user or a team actually signing in? A sudden drop from their established pattern is a massive red flag.
- Feature Adoption Rate: Are they using the "sticky" features that really deliver on your product's promise? If not, they haven't woven it into their daily workflow.
- Session Duration and Depth: When they log in, are they staying for a while and getting work done? Or are sessions short and shallow, hinting at frustration or confusion?
- Key Action Completion: Are they hitting the milestones that correlate with success? Things like exporting a report, inviting a teammate, or finishing a key setup process.
This raw behavioral data is what you’ll turn into predictive features for your model. For example, a simple "last seen" timestamp becomes a powerful "days since last activity" metric—a number that directly quantifies how disengaged someone is.
Transactional and Subscription Data
While product usage tells you how customers feel, their billing history tells you what they're doing with their wallets. This data, often sitting in a system like Stripe, offers up some of the most objective signals you can get about an account's health.
A clean history of successful payments usually means a stable, happy customer. But when you start seeing failed payments or downgrades, it often points to bigger problems bubbling under the surface. A customer who downgrades their plan is literally telling you they’re re-evaluating what you’re worth to them.
Keep a close eye on this information:
- Subscription Changes: Have they upgraded, downgraded, or paused their plan recently? A downgrade is one of the strongest predictors of churn you can find.
- Payment History: A string of on-time payments is a great sign. But repeated failed payments, even if they're unintentional (involuntary churn), can easily lead to a lost customer.
- Plan and MRR Information: Knowing their subscription tier and monthly recurring revenue (MRR) helps you understand the financial impact of a potential cancellation.
Demographic and Firmographic Data
Who your customers are is often just as important as what they do. Demographic data (for B2C companies) or firmographic data (for B2B) gives you the context you need to spot patterns across different segments of your user base.
For instance, you might discover that startups in the fintech space are far more likely to churn, or that users with a "Project Manager" title are your stickiest customers. This kind of insight is gold because it helps you focus your retention efforts where they'll have the biggest impact.
Tracking attributes like company size, industry, and a user's role allows you to slice your data and find risks that would be totally invisible if you only looked at the big picture.
Comparing Customer Churn Prediction Models
Picking the right model for customer churn prediction is a lot like choosing the right tool for a job. You wouldn't use a sledgehammer to hang a picture, and you wouldn't use a tiny screwdriver to break down a wall. Each modeling approach strikes a different balance between simplicity, accuracy, and the depth of insight it gives you.
The journey into churn modeling usually starts with simple, rule-based systems—they’re the most straightforward and easiest to get running. From there, you can graduate to more powerful statistical models that start to explain why churn is happening. Finally, the path leads to machine learning, which can uncover complex, nearly invisible patterns in your customer data.
Let's break down each of these approaches.
Simple Heuristics: Your Starting Point
The most basic way to predict churn doesn’t involve any fancy algorithms. It relies on heuristics, which are really just common-sense rules you create based on your gut feeling about user behavior. Think of it as turning your team's intuition into a concrete rule.
A classic example is flagging any customer who hasn’t logged into your platform in 30 days. It’s a simple, binary rule that’s dead easy to track and act on. While it’s not the most sophisticated method, it’s a huge improvement over doing nothing at all.
These models are perfect for:
- Getting started quickly without needing a data science team.
- Validating your initial assumptions about what signals churn.
- Creating a baseline to measure more advanced models against later.
The biggest downside? Heuristics are rigid. They can't adapt to evolving user habits and often create a lot of "false positives," flagging customers who aren't actually at risk.
Statistical Models: Uncovering the "Why"
Once you’re ready to move past simple rules, traditional statistical models like Logistic Regression are the natural next step. Think of Logistic Regression as a skilled investigator. It doesn’t just tell you if a customer might churn; it helps you understand why by pinpointing which factors are most influential.
This model weighs different data points—like login frequency, the number of support tickets filed, and the subscription plan—to calculate a final churn probability. Because it assigns a specific weight to each feature, you can see exactly what’s driving churn in your user base. This “explainability” is its greatest strength, making it a favorite for teams that need to justify their retention strategies to leadership.
Machine Learning: Finding Hidden Patterns
This is where things get really powerful. Machine Learning (ML) models, like Random Forests and Gradient Boosting, are like bringing in a team of elite detectives. These models can sift through enormous amounts of data to uncover subtle, non-linear relationships that simpler statistical models would completely miss.
Imagine trying to predict churn by looking at a customer's behavior, their transaction history, and their support interactions all at once. The infographic below shows how a decision tree—a core component of models like Random Forests—might process this information.
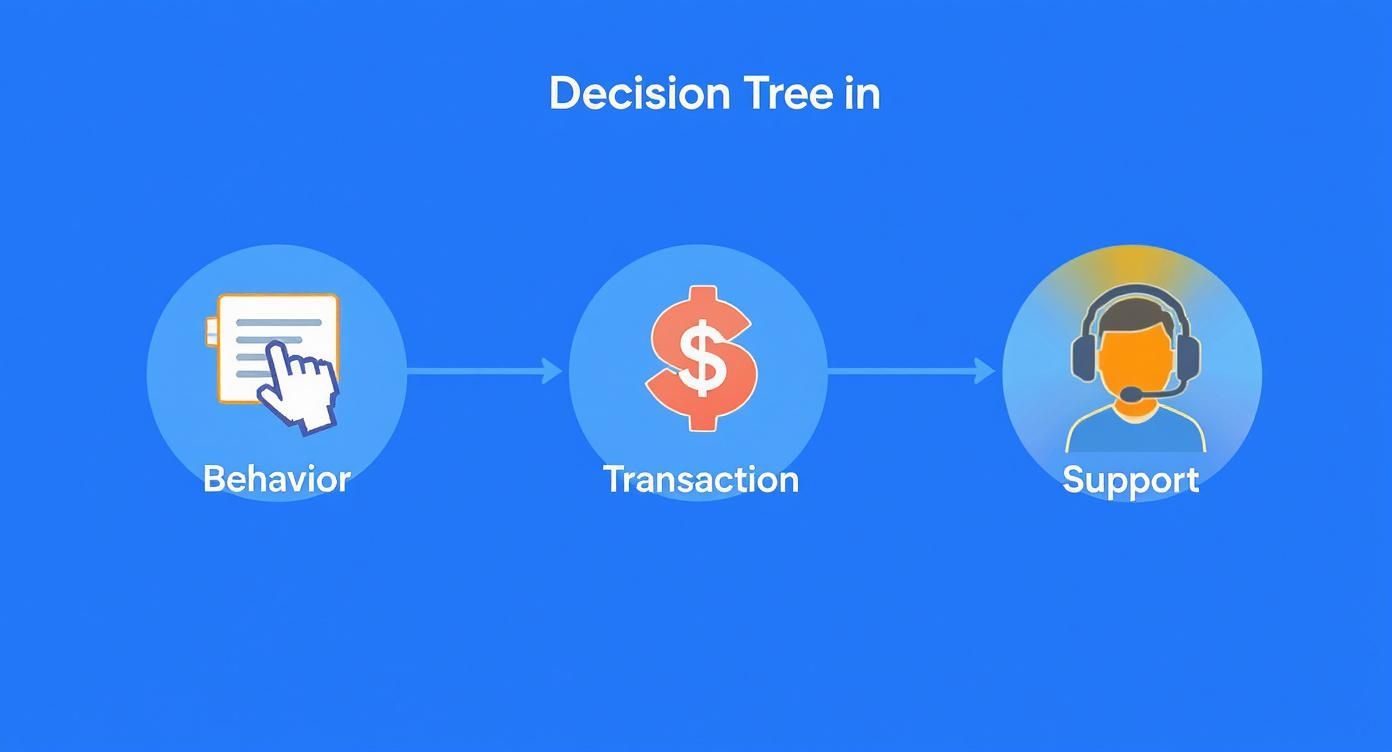
The model follows different paths based on what a customer does, which allows it to make highly nuanced predictions about who is likely to stay or leave.
A Random Forest, for example, builds hundreds of these individual decision trees and then averages their predictions. This "wisdom of the crowd" approach makes it incredibly accurate and robust, much like getting a consensus from a room full of experts. It can identify complex scenarios that a human might miss, like a user whose high engagement is actually a sign of frustration as they desperately search for a feature that doesn't exist.
Key Takeaway: While statistical models are fantastic for explaining the drivers of churn, machine learning models excel at pure predictive accuracy, often identifying at-risk customers with much higher precision.
The evolution of churn prediction has been driven by big leaps in both statistics and machine learning. More recently, deep learning models like Long Short-Term Memory (LSTM) networks have shown a remarkable ability to analyze sequences of customer actions over time. One study even found that businesses using LSTM-based systems hit an accuracy rate of over 85% in flagging customers likely to churn within three months. You can dive deeper into these advanced techniques and their performance in recent research.
Choosing the right approach depends entirely on your team's resources, the complexity of your data, and your ultimate business goals. This table should help clarify the trade-offs.
Comparison of Churn Prediction Modeling Approaches
| Model Type | Complexity | How It Works (Analogy) | Best For |
|---|---|---|---|
| Heuristics (Rules-Based) | Low | A Tripwire: You set a simple rule, like "no login in 30 days." If a customer crosses it, an alarm goes off. | Startups or teams without data scientists who need a "good enough" solution right now. |
| Statistical (Logistic Regression) | Medium | An Investigator: It examines all the evidence (features) and explains which clues are most strongly linked to the outcome (churn). | Teams that need to understand why churn is happening and present clear reasons for their retention strategies. |
| Machine Learning (Random Forest) | High | A Team of Experts: It builds hundreds of "decision trees" and combines their insights to make a highly accurate, consensus-based prediction. | Teams with access to lots of data and a primary goal of maximizing predictive accuracy, even if the "why" is a bit of a black box. |
Ultimately, whether you start with a simple rule or deploy a sophisticated ML algorithm, the goal is always the same: to turn your data into foresight and protect your revenue.
How to Measure Churn Prediction Success
So you've built a customer churn prediction model. That’s a huge step, but let's be honest, it's only half the battle. A model is just a black box unless you can actually trust what it tells you. To figure out if your predictions are reliable, you need to measure their performance with the right metrics.
Most people immediately jump to "accuracy" as the go-to measurement. If a model is 95% accurate, that sounds amazing, doesn't it? Well, not so fast. When it comes to churn, accuracy can be a dangerously misleading number.
Think about it: let's say you have 1,000 customers, but only 20 of them (2%) are actually going to churn this month. A lazy model that simply predicts no one will churn would be 98% accurate. While technically correct most of the time, it's completely useless for your retention efforts because it identifies zero at-risk customers.
Moving Beyond Simple Accuracy
To get the real story, you have to use metrics that tell you how well the model performs on that small—but incredibly important—group of customers who are actually at risk. This is where Precision and Recall become your best friends. They help you answer two very different, but equally critical, questions about your model's predictions.
Imagine your model is a detective trying to spot potential churners in a crowd.
Precision asks: "Of all the customers you flagged as risks, how many actually churned?" This tells you how trustworthy the "at-risk" label is. High precision means your customer success team isn't wasting time and resources on happy, healthy customers.
Recall asks: "Of all the customers who actually churned, how many did your model successfully catch?" This measures how good your model is at finding the real churners. High recall means you have fewer nasty surprises at the end of the month.
In a perfect world, you'd have high marks for both, but there's almost always a trade-off. If you tune your model to be more sensitive and flag more potential risks (boosting Recall), you'll probably get more false alarms (lowering Precision). Finding the right balance is a strategic decision for your business.
The goal isn't just to be "right" in a statistical sense; it's to generate a reliable list of at-risk customers that your team can act on confidently. Wasting your customer success team's time on false alarms can be just as costly as missing a real churn signal.
Defining Your Prediction Window
Another key part of this puzzle is defining your prediction window. This is the timeframe you’re forecasting for. Are you trying to predict who will leave in the next 7, 14, or 30 days? This isn't just a data science question; it's an operational one.
A 7-day window might give you incredibly precise predictions, but it barely gives your team enough time to react. A frantic, last-minute email probably won't save a customer. On the other hand, a 60-day window gives you plenty of time to run a full-fledged retention campaign, but the predictions will naturally be fuzzier. A lot can change in two months.
For most SaaS companies, a 14- to 30-day window is the sweet spot. It provides enough lead time for meaningful outreach—a personalized email, a call from a success manager, a targeted training session—without sacrificing too much predictive power.
Ultimately, you know your model is working not just by its stats, but by its ability to help you improve your overall retention ratio formula and protect that hard-earned revenue.
Turning Churn Predictions into Action
A model that spits out a list of at-risk accounts is a powerful start, but it’s just that—a start. Knowing who might leave doesn't actually save you any money. The real value comes from what you do with that information. Without a solid plan, your predictions are just interesting data points, not the revenue-saving tools they’re meant to be.
The goal is to shift from just analyzing the problem to actively preventing it. This means weaving your churn scores directly into the daily life of your customer-facing teams. When a high-risk score pops up, it shouldn't just sit on a dashboard. It needs to kick off a specific, well-rehearsed set of actions.
Building Your Churn Intervention Playbooks
The single most effective way to turn predictions into results is by creating retention playbooks. Think of these as pre-defined game plans tailored to different levels of churn risk. A one-size-fits-all approach just doesn't work here. A customer who's slightly disengaged needs a completely different touch than one who’s already halfway out the door.
It's a lot like a medical triage system. You wouldn't treat a minor scrape with the same urgency as a major injury. In the same way, your playbooks should segment customers by their churn score and their value to your business. This ensures you’re focusing your team’s precious time and resources where they’ll make the biggest difference.
A well-oiled playbook system brings consistency, scalability, and speed to your retention efforts. When a risk alert comes in, everyone on the team knows exactly what to do. It takes the guesswork out of the equation and lets you act immediately and effectively.
Low-Risk Customer Interventions
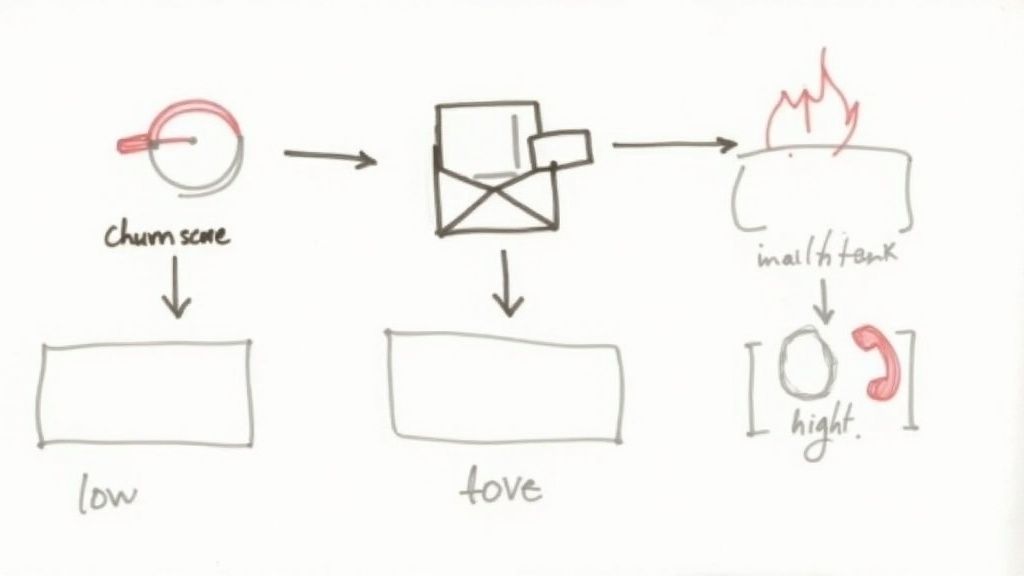
For customers with a low churn risk score (say, 20-40%), the name of the game is gentle, automated re-engagement. These users might just need a little nudge to remember why they signed up in the first place. The key is to be helpful, not pushy. Coming on too strong with this group can actually backfire and make them feel pressured.
Here are a few low-touch, automated ideas:
- Value-Reinforcement Emails: Set up an email that triggers when a user hasn't tried a key feature, showcasing what they're missing out on. A relevant case study works great here, too.
- Helpful In-App Messages: Use a subtle pop-up to highlight a recent product update or point them toward a helpful tutorial.
- Resource Sharing: Send them a link to a new blog post or an invite to a webinar that speaks directly to their goals.
These small actions keep your brand top-of-mind and subtly guide users back to value, all without tying up your team's time.
High-Risk Customer Interventions
Now, when a customer gets flagged with a high churn risk score (think 70% or higher), it’s go-time. This is an all-hands-on-deck situation, especially if it’s a high-value account. Automation takes a backseat to real, human intervention.
A high churn score for a major account is not a problem for tomorrow—it's a fire that needs to be put out today. The speed and quality of your personal outreach can be the deciding factor between saving the account and losing it.
Your high-risk playbook should trigger alerts that get to the right people, right away:
- Instant CSM Alert: The assigned Customer Success Manager (CSM) needs an immediate ping in Slack or their CRM with the customer’s name, churn score, and the key reasons why they're at risk.
- Personalized Check-in Call: The CSM’s first move should be scheduling a call. This isn't a sales call; it's a listening tour. The goal is to understand their frustrations and genuinely offer help.
- Executive Outreach: For your top-tier accounts, having a VP or C-level executive reach out can show the customer just how much you value their business. It’s a powerful move.
This kind of direct, empathetic approach is critical for digging into the root cause of their unhappiness and starting to rebuild the relationship. While budget is often cited as a reason for leaving—accounting for 33% of cancellations—it’s frequently a smokescreen for bigger issues with product value or service. In fact, research shows that companies using personalized engagement see a 20% lower churn rate than those who just throw discounts at the problem.
By putting these playbooks in place, you create a system that ensures every churn prediction leads to a concrete, measurable action. This is the operational discipline that transforms a clever prediction model into a powerful retention engine. For teams looking to roll this out without a massive engineering project, platforms like LowChurn offer fast-install solutions that connect directly to Stripe, giving you both the predictions and the actionable playbooks you need to protect your revenue.
Common Questions About Churn Prediction
Even with a solid plan, actually diving into churn prediction brings up a ton of practical questions. How much data do we really need? What do we do about brand-new customers? How often does this thing need a tune-up? Getting these answers right is the key to building a system your team will actually trust and use.
Let's tackle the most common questions we hear from teams just starting out.
How Much Data Do I Need to Start Predicting Churn?
You don't need a petabyte of data from the last decade. A great starting point is having a few hundred past churn events—real, actual cancellations—paired with several months of consistent user activity and billing data.
Honestly, quality and consistency trump sheer volume, especially at the beginning. Even a relatively small, clean dataset can power a first-pass model that catches the most obvious churn signals. This gives you an immediate baseline you can build on as more data flows in.
Can You Predict Churn for New Customers?
This is a classic challenge. Predicting churn for new users is tough because you have no history with them—it's often called the "cold start" problem. You can't analyze their past behavior if they don't have any yet.
For these customers, your early predictions have to rely on who they are, not what they've done. You'll lean heavily on demographic or firmographic data points like company size, industry, or the user's specific role. As soon as they start using your product and creating a behavioral footprint, the model's accuracy for that person will improve dramatically.
How Often Should a Churn Prediction Model Be Retrained?
A churn model is not a crockpot—you can't just set it and forget it. Your product changes, your customer base evolves, and the market shifts. That means the signals that once pointed to churn will inevitably change, too. For your model to stay sharp, it has to adapt.
As a rule of thumb, plan on retraining your model on a regular schedule, like quarterly, to keep its predictions relevant. However, if you push a major product update or see a sudden, weird shift in user behavior, you'll want to retrain it right away.
Keeping your model fresh ensures your team is always working with the most reliable insights. For more ideas on building a proactive retention strategy, you can find valuable tips on the LowChurn blog.
Ready to stop reacting to churn and start preventing it? LowChurn delivers AI-powered churn predictions and actionable playbooks directly from your Stripe data in minutes. https://www.lowchurn.com