
Think of a customer health score as a vital sign for your SaaS business. It's a single, powerful metric that distills complex customer data into a straightforward score, telling you at a glance which customers are thriving and which might be on the verge of churning.
Why a Customer Health Score Matters

Trying to run a SaaS company without a clear view of customer health is like trying to navigate a ship in the dark without a compass. You can see revenue coming in, sure, but you have no real way of knowing which accounts are silently drifting toward cancellation. A customer health score is the light that guides your way.
This simple metric is what moves your team from a reactive "firefighting" mode—where you only scramble to save an account after they complain or threaten to cancel—to a proactive, strategic approach. It gives you a data-driven pulse on your entire customer base.
The Shift From Guesswork to Prediction
Without a health score, many customer success managers (CSMs) have to rely on gut feelings or random anecdotes to figure out how an account is doing. While a CSM's intuition is valuable, it just isn't scalable or consistently accurate across a whole team. A formal scoring system replaces that guesswork with objective data.
Ultimately, this means no at-risk customer slips through the cracks. It helps you:
- Anticipate Needs: Spot customers who are struggling with your product before they even think to submit a support ticket.
- Prevent Churn: Step in with targeted help for at-risk accounts before they've made the decision to leave.
- Find Expansion Opportunities: Easily identify your most engaged, healthy customers who are prime candidates for an upsell or new feature adoption.
- Improve Forecasting: Get a much clearer, more predictable picture of your future revenue and retention rates.
This proactive approach has a huge impact. Companies that actively monitor and act on customer health see far better retention. It's no surprise that the customer success platform market is expected to hit $3.1 billion by 2026, a testament to the industry's investment in these predictive tools. You can discover more insights about customer success trends on custify.com.
To understand its components and value quickly, here's a simple breakdown.
Customer Health Score At a Glance
| Component | Description | Business Impact |
|---|---|---|
| Data Inputs | Metrics like product usage, support tickets, survey responses, and billing history. | Provides a 360-degree view of the customer relationship. |
| Scoring Logic | Rules or models that weigh different inputs to calculate a final score. | Turns raw data into an actionable, easy-to-understand metric. |
| Health Segments | Categories like "Healthy," "At-Risk," and "Poor" based on the score. | Allows for targeted, segment-specific interventions. |
| Team Playbooks | Pre-defined actions for CSMs to take based on a customer's health score. | Ensures consistent, proactive engagement and churn prevention. |
| Outcomes | The end goals: reduced churn, increased expansion revenue, and better forecasting. | Directly ties customer success activities to bottom-line growth. |
This table shows how a health score isn't just a number; it's a complete system for understanding and acting on customer behavior.
A Common Language for Your Entire Company
One of the most powerful, and often overlooked, benefits of a customer health score is how it gets everyone on the same page. This isn't just a metric for the Customer Success team.
A well-defined health score becomes a universal language. It allows Sales, Marketing, Product, and Success teams to have a shared understanding of what a "good" customer looks like, fostering collaboration and focusing everyone on the same goal: delivering value and driving retention.
Think about it. When the product team sees health scores dip after a new feature release, they get instant, unbiased feedback. When marketing sees a segment of incredibly healthy customers, they know exactly who to target for case studies or referral programs. This shared metric breaks down department silos and makes sure every part of the business is actively contributing to a customer's success.
The Building Blocks of a Powerful Health Score
A truly effective customer health score isn't some magic number pulled from a single metric. It's more like a composite sketch of your customer relationship, pieced together from different clues. If you only look at one thing—say, how often they log in—you’re getting a blurry, incomplete picture. You might think everything’s fine, right before they churn.
To get a score that actually predicts what a customer will do next, you need to blend signals from every corner of their experience. Each data point tells part of the story, and when you put them all together, you get a reliable indicator of whether they're at risk or primed for growth.
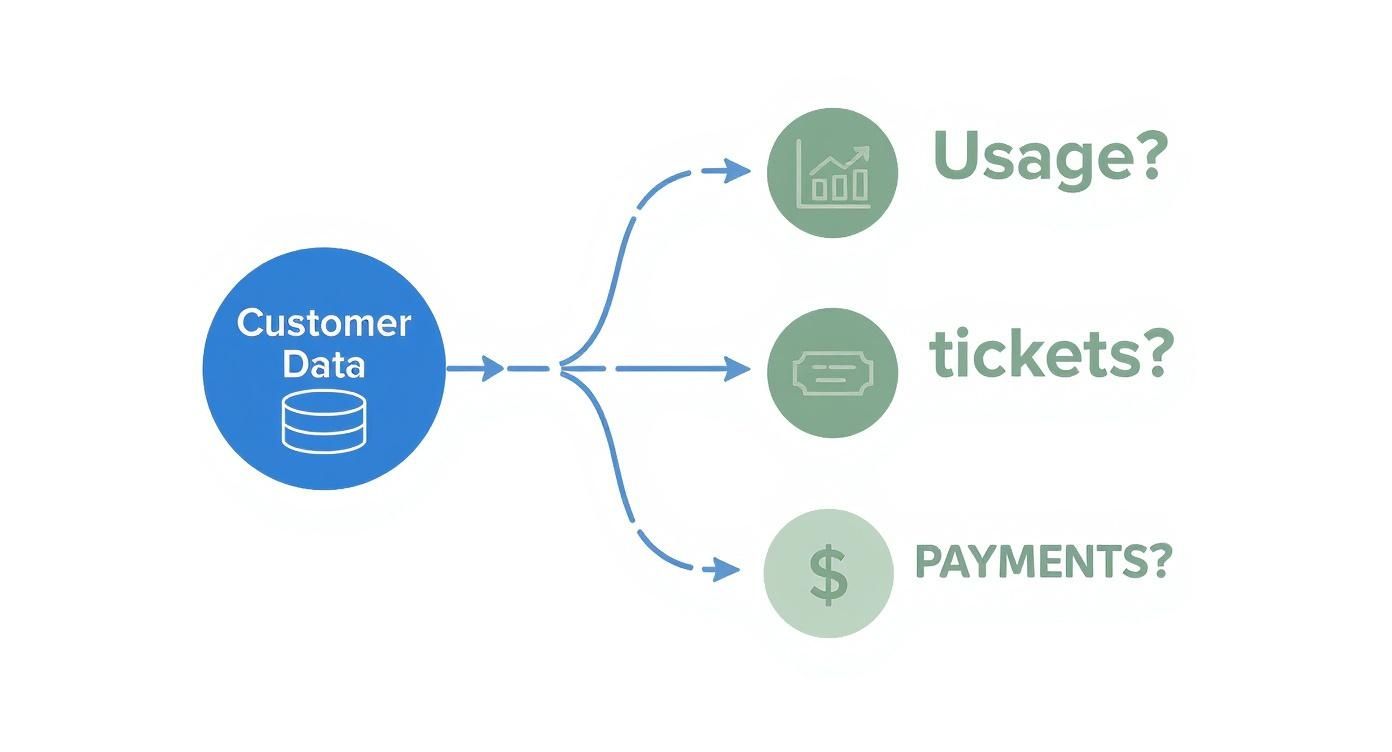
We can break these essential ingredients down into four key areas.
Product Usage and Adoption Metrics
This is ground zero. It answers the most basic question: "Are people actually using the thing they're paying for?" If your product is deeply embedded in a customer's daily workflow, that’s the strongest sign of a healthy account.
But just looking at logins is surface-level stuff. You have to dig deeper to see what real engagement looks like.
- Feature Adoption: Are they using the "sticky" features—the ones that deliver the core value? Someone who only uses a minor, secondary feature is way less healthy than an account that has adopted your main functionality.
- Login Frequency: How often are they signing in? Daily? Weekly? A sudden drop-off is one of the oldest and most reliable churn warnings in the book.
- Session Duration: When they do log in, are they sticking around? Longer, focused sessions usually mean they're getting real work done and extracting value.
- Time to First Value (TTFV): How fast did they get their first "aha!" moment after signing up? A quick win is a massive predictor of long-term success.
Support and Service Interactions
How a customer talks to your support team is a goldmine of information. It gives you a direct look into their experience, revealing frustrations or points of friction that product analytics will never show you.
It's easy to assume that a lot of support tickets is a bad sign, but it’s not that simple. The context is what really matters.
A customer who submits a bunch of tickets that your team resolves quickly is often more engaged and healthier than the one who's struggling in silence and has already given up on asking for help.
Here’s what to keep an eye on:
- Ticket Volume: A sudden spike can mean something is seriously broken. But zero tickets could mean they're perfectly happy… or completely disengaged. You need other data to know which.
- Resolution Time: Are you solving their problems quickly? Nothing sours a relationship faster than letting issues fester.
- Ticket Sentiment: What’s the tone of the conversation? Most modern helpdesks can analyze sentiment, giving you a quick read on whether interactions are positive or negative.
Financial and Commercial Signals
Let’s be honest: money talks. A customer’s financial behavior is a clean, objective indicator of how much they value your service. These signals are often the easiest to track and interpret.
An account that always pays on time and just upgraded their plan is screaming, "We love this!"
- Payment History: Are they consistently on time, or are payments starting to slip? Late payments can be an early sign that they're either in financial trouble or your tool has been moved to the bottom of their priority list.
- Upgrade/Downgrade History: This one is crystal clear. Upgrades are a huge positive signal, while downgrades are a massive red flag.
- License Utilization: If you have a seat-based model, are they using all the licenses they pay for? If a 20-person team is only using 5 licenses, they’re overpaying and are a prime candidate to downgrade or churn.
Customer Engagement and Feedback
Finally, you have to look beyond the product itself. This is all about their relationship with your company as a whole, from direct feedback to how they interact with your brand. This holistic view is becoming non-negotiable for SaaS.
The whole subscription economy is shifting toward consolidating these different data points—from usage to support tickets—to get ahead of churn and spot growth opportunities. You can read more on the future of predictive analytics at truefan.ai.
A few key metrics to pull in:
- NPS/CSAT Scores: Don't underestimate direct feedback. Net Promoter Score and Customer Satisfaction surveys are your clearest window into customer sentiment.
- Marketing Engagement: Are they opening your newsletters, showing up for webinars, or reading your blog? This shows they’re plugged into your ecosystem, not just your software.
- CSM Pulse: This is the human element. It’s a qualitative score from the Customer Success Manager based on their gut feeling and conversations. A good CSM can often spot trouble long before the data does.
How To Calculate Your Customer Health Score
Alright, so you’ve figured out what ingredients go into your customer health score. The next big question is: how do you mix them all together to get a single, useful number? There isn't a magical, one-size-fits-all formula. The right approach really depends on how much data you have and what stage your business is at.
Think of your different customer data streams—product usage, support tickets, payment history—as the raw inputs. Your job is to decide on the best model to process them.
Each of these branches tells a part of the story. Now, let’s look at the three most common ways to bring that story together into a clear score.
Comparing Health Score Calculation Models
To make sense of the options, it helps to see them side-by-side. Each model has its place, and what works for a startup might not be enough for an enterprise.
This table breaks down the three primary methods for calculating a health score, giving you a quick look at their complexity, key benefits, and where they shine the brightest.
| Model | Complexity | Key Advantage | Best For |
|---|---|---|---|
| Simple Rule-Based | Low | Easy to implement and understand. | Startups and teams new to health scoring. |
| Weighted Scoring | Medium | More accurate and nuanced than rules. | Most growing SaaS businesses. |
| AI / Machine Learning | High | Uncovers hidden patterns and predicts future behavior. | Mature companies with large, clean datasets. |
As you can see, the choice is all about balancing precision with practicality. Let's dig into what each one actually looks like in practice.
The Simple Rule-Based Model
This is your starting point. Think of it as the "get it done now" model. It’s the quickest way to get a health scoring program running because it’s based on simple, if-then logic without any complex math. You just define a set of conditions that sort customers into buckets.
For example, a customer is automatically flagged as “Poor” if they haven't logged in for 30 days. On the flip side, they’re “Healthy” if they use a key feature every day and just gave you a great NPS score.
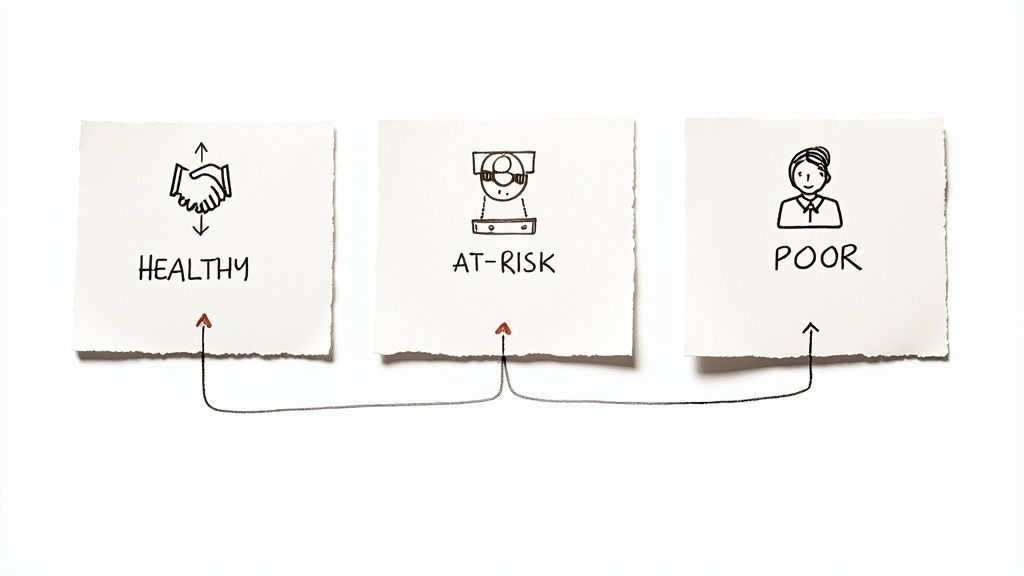
This approach gives your whole team clear, easy-to-understand categories:
- Healthy: Ticking all the right boxes.
- At-Risk: Showing a few warning signs.
- Poor: Flashing multiple red flags.
The biggest downside? It’s a bit blunt. A customer might be just one tiny action away from being "Healthy" but still get lumped into the "At-Risk" pile, which doesn't give you the full picture.
The Weighted Scoring Model
Here's where things get more interesting. This is easily the most popular and balanced approach for a reason. Instead of rigid rules, you assign a "weight" to each metric based on how much it actually impacts customer success. This lets you build a much more precise score, usually on a 0 to 100 scale.
First, you score each individual metric (say, from 0-10). Then, you multiply that score by its assigned weight. The metrics that are strong signals of retention, like adopting a "sticky" feature, get a heavier weight.
Let's see what that looks like:
| Metric | Raw Score (0–10) | Weight | Weighted Score |
|---|---|---|---|
| Feature Adoption | 9 | 40% | 3.6 |
| Login Frequency | 7 | 20% | 1.4 |
| NPS Score | 8 | 20% | 1.6 |
| Payment History | 10 | 10% | 1.0 |
| Support Tickets | 6 | 10% | 0.6 |
| Total Health Score | 100% | 82 / 100 |
This method gives you a far richer story. In this example, the customer’s heavy product usage outweighs their slightly lower support score, landing them a healthy overall rating of 82.
The magic of the weighted model is its flexibility. You can, and should, adjust these weights over time as you learn more about what truly drives retention and churn in your specific business.
The AI and Machine Learning Model
Welcome to the cutting edge of customer health scoring. Here, instead of you setting the rules or weights, you let a machine learning algorithm sift through all your historical data to find the hidden patterns that predict churn and renewal.
The system might uncover connections you’d never think to look for. For example, it might find that customers who use Feature A and Feature C together, but almost never contact support, have a 95% renewal rate.
The predictive power here is unmatched, but it comes with a catch. This approach demands a huge amount of clean data and the technical know-how to build and manage the models. For most startups, a well-tuned weighted model is a much more practical place to start.
But as you scale, looking into a predictive model can give you a serious advantage. If you want to dive deeper into this world, our guide to customer churn prediction is a great place to start.
Turning Scores into Actionable Segments
A customer health score of 82 is a nice data point, but let's be honest—on its own, it’s just a number. It doesn't tell your team what to do next. To really get value out of your health score, you need to translate it into clear, meaningful segments that trigger specific actions.
Think of it like a traffic light for your customer base. This simple act of setting thresholds transforms a metric into a command center. You can immediately see who’s in the green (healthy and thriving), who’s in the yellow (needs attention), and who’s flashing red (major churn risk).
Most teams start with a simple, three-tiered system:
- Healthy: These are your rockstars. They're using the product, getting value, and are your best candidates for case studies, referrals, and upsells.
- At-Risk: Something’s off here. Maybe product usage is dipping, or they have a few overdue support tickets. These accounts need a proactive nudge to get them back on the right track.
- Poor: This is the danger zone. These accounts are showing clear signs of potential churn—severely low engagement, recent payment failures, you name it. They need immediate, hands-on intervention.
Setting Your Health Score Thresholds
So, where do you draw the lines between green, yellow, and red? A score of 70 might be fantastic for one business but a sign of trouble for another. The secret is to stop guessing and let your own data tell the story.
The best way to set these benchmarks is to look back. Pull a list of every customer who churned in the last 6-12 months and analyze their health scores in the final weeks before they left. Then, do the exact same thing for customers who renewed or upgraded.
You'll start seeing patterns almost immediately. For instance, you might discover that 85% of your churned customers had a score below 40 for at least a month before they canceled. Boom. You now have a data-backed reason to set your "Poor" health threshold right there.
The goal is to connect score ranges to real business outcomes. When you ground your thresholds in historical churn and renewal data, you remove the guesswork and create segments that actually predict what customers will do next.
While your own data is king, industry benchmarks can be a good sanity check. For example, many SaaS companies find that scores between 75-100 correlate with high renewal rates, while the 40-74 range is a common sweet spot for the "at-risk" category. You can find more of these kinds of benchmarks in these customer success statistics on custify.com.
Refining Your Segments Over Time
Here’s the thing: these thresholds aren't set in stone. Your product will evolve, your customer base will change, and what "healthy" means today might not be what it means a year from now.
Make it a habit to review your health score model and its thresholds at least every six months. As you collect more data, you’ll be able to fine-tune everything for better accuracy.
For example, if you see customers in your "Healthy" segment churning unexpectedly, it’s a red flag. It could mean your threshold is too low, or maybe you're missing a critical input in your score calculation. This cycle of continuous improvement is what keeps your health score a reliable leading indicator of your retention ratio. Speaking of which, we have a whole guide that breaks down the retention ratio formula.
Creating Playbooks for Each Health Segment
A customer health score is only as good as the action it inspires. If it just sits on a dashboard as a passive number, you're missing the entire point. The real magic happens when you build specific, repeatable playbooks for each health segment, turning that data into a proactive customer success engine.
Think of these playbooks as your team's strategic response plans. When a customer's score dips into the "At-Risk" bucket, your team shouldn't be scrambling or guessing what to do. A solid playbook gives them a clear set of steps, triggers, and goals, ensuring a consistent and effective response every single time. This is how you operationalize your health score and start seeing a real impact on your churn rate.
The Playbook for Poor Health Customers
When a customer's score plummets into the "Poor" category (let's say, below 40), the alarm bells should be ringing loud and clear. This isn't the time for automated emails. This segment requires immediate, high-touch intervention to figure out what went wrong and see if the relationship can be salvaged.
Your goal here isn't to sell them anything. It's to listen. The primary objective is to understand their frustration and prove you’re invested in getting them back on track.
Key Actions for Poor Health Accounts:
- Immediate CSM Outreach: The assigned Customer Success Manager (CSM) needs to personally reach out within 24 hours. This has to be a direct email or a phone call, not some generic automated message.
- Run a Diagnostic Call: Get them on the phone and just listen. Ask open-ended questions to uncover their pain points, find out what’s changed in their business, and pinpoint exactly where your product is letting them down.
- Create a Formal Recovery Plan: Don't leave the call with vague promises. Put together a documented plan with clear, achievable milestones to get them back to a good place. This might mean extra training, a deep-dive with technical support, or even a call with a product manager.
- Schedule a Follow-Up: Before you hang up, book a check-in call for 1-2 weeks out. This shows you're serious about the plan and keeps the momentum going.
The Playbook for At-Risk Customers
Customers in the "At-Risk" segment (e.g., scores from 40-74) are often the ones quietly slipping away. They haven't thrown in the towel yet, but their product usage is dropping, or they keep hitting the same roadblocks. This is your golden opportunity to re-engage them before their problems escalate.
The At-Risk playbook is your most important proactive defense against churn. By addressing minor issues before they become major frustrations, you can efficiently guide these customers back to a healthy state and prevent them from ever entering the "Poor" health danger zone.
For this group, a smart mix of automation and light-touch personal outreach usually works best.
- Trigger Automated Nudges: Set up an email sequence that kicks in automatically when a score drops into this range. This campaign can offer genuinely helpful resources, like a link to a relevant webinar or a guide to a powerful feature they haven't adopted yet.
- Offer Proactive Training: Invite them to a group Q&A or an "office hours" session focused on best practices. It’s a low-effort way to deliver a ton of value to many at-risk customers at once.
- Light-Touch CSM Check-in: If the automated nudges aren't moving the needle, a CSM can send a brief, personal email. Something simple like, "Hey, noticed you haven't used X feature yet, is there anything I can help with?" can work wonders.
The Playbook for Healthy Customers
Your "Healthy" customers (with scores of 75+) are your biggest asset. The playbook here isn't about saving them from churn; it's about turning them into advocates and spotting growth opportunities. A huge mistake teams make is ignoring this group, which is like leaving expansion revenue on the table.
The goal is simple: validate their success and strategically find ways to deepen the partnership.
- Identify Upsell Opportunities: A consistently high health score is the perfect trigger for an expansion conversation. A CSM can reach out to talk about their future goals and see if a plan upgrade or a new add-on could help them get there faster.
- Request Case Studies and Referrals: These customers are your champions! When their score is at its peak, it’s the best time to ask for a testimonial, a G2 review, or an introduction to another team in their network.
- Invite to Beta Programs: Make them feel like true insiders by giving them early access to new features. This not only strengthens their loyalty but also gives your product team priceless feedback from your most engaged users.
How to Automate Your Health Scoring System
Let's be honest: a manual customer health score is a snapshot that’s stale the moment you calculate it. If you want to get ahead of churn, your team needs to know what’s happening right now, not what happened last Tuesday. That’s why automation isn’t just a nice-to-have; it’s a core part of any modern churn-fighting strategy.
Building an automated system is all about creating a central hub where your customer data can flow together. The real magic happens when you can integrate signals from every corner of their journey, from the first time they log in to their most recent payment.
This process involves connecting the dots between the essential tools your business already relies on every day.
Building Your Automated Tech Stack
The goal here is to get out of spreadsheets for good. Instead of manually pulling data, you need a system that automatically grabs the latest information, calculates the health score, and keeps it updated in real-time. This gives your team confidence that they’re always acting on the freshest, most accurate data possible.
Your core data sources will almost always include these four pillars:
- Your CRM: This is ground zero for customer information, holding the details on account size, contract terms, and every touchpoint you've had.
- Billing Platform (like Stripe): Money talks. Integrating your billing system gives you a live feed on payment status, plan changes, and overall subscription health. These are some of the strongest signals you have.
- Product Analytics Tools: These tools show you exactly what users are doing inside your product—who’s engaged, which features they love, and how often they’re showing up.
- Support Desk: Nothing gives you a clearer window into customer frustration (or happiness) than support tickets. High ticket volume or slow resolution times are massive red flags.
By piping these different data streams into one central platform, you finally get a single source of truth for customer health.
An automated system doesn’t just save time; it changes how customer success works. It moves your team from being data archeologists, digging through old information, to being strategic first responders, acting on live intelligence.
The Power of Real-Time Scoring
The biggest win from automation is the move from delayed, batch updates to genuine real-time scoring. A weekly or even daily batch update leaves a dangerous blind spot. A customer could completely stop using your product on Monday, but your team might not know until Friday. By then, it could be too late to save them.
Real-time scoring, on the other hand, alerts you to a major change the moment it happens. This speed is a total game-changer.
Imagine a healthy customer's score suddenly tanks because their product usage flatlines. An automated system can instantly trigger an alert for their CSM, who can then reach out proactively to see what’s wrong. That’s how you get ahead of the problem.
This is especially powerful for SaaS businesses using Stripe, where subscription events are happening all the time. With a tool like LowChurn, you can connect your Stripe account and install a simple code snippet to start analyzing product usage right alongside subscription data. The system then generates dynamic health scores, creating an early warning system to protect your MRR.
Data Privacy and Getting Started
Of course, when you start connecting all these systems, data privacy has to be top of mind. Make sure any platform you choose handles customer data responsibly. A well-designed system, for example, should only need read-only access to billing data and should focus on subscription metadata, not sensitive financial details or personal info.
The good news is you don’t need a mountain of data to get started. You can begin with just a few key inputs: product usage frequency, Stripe subscription status, and key feature adoption. From there, you can layer in more data points over time to make your customer health score model even more accurate.
Common Questions About Customer Health Scores
Once a team decides to get serious about customer health scoring, a few practical questions almost always pop up. Answering them upfront is the key to building a system that your team actually trusts and uses every day. Let's walk through some of the most common ones.
How Long Until We See Results From a Health Score?
You'll get some interesting insights right away, but the real magic—the predictive power—takes a bit of time to bake. Most companies start to see truly reliable results within 3 to 6 months.
Why that long? A few things need to happen. First, you need enough data to see if your scoring model is actually on the right track. Second, you need to run your new intervention playbooks for a full quarter or two to see if they're making a real difference in customer behavior and, more importantly, your retention numbers.
Should Our Health Score Include Qualitative Feedback?
Yes, one hundred percent. While hard data like product usage and payment history are the foundation of a good score, leaving out qualitative feedback is like trying to understand a story by only reading every other page. The human element provides the why behind the what.
A customer might be logging in every day, but they could be absolutely furious about a recent UI change. Without that qualitative piece, your score would happily flash 'Green' right before they hit the cancel button.
This kind of feedback adds context that numbers alone just can't capture. Here are a few ways to work it in:
- Add a CSM Pulse: This is a simple, subjective rating from the Customer Success Manager based on their gut feeling and recent chats with the account.
- Factor in Survey Sentiment: Pipe NPS or CSAT scores directly into your health calculation.
- Analyze Support Ticket Tone: Use sentiment analysis tools to flag frustration in support conversations.
How Often Should We Update Our Health Score Model?
Think of your health score model as a living, breathing system, not a one-and-done project. Your product is going to change, your customers' expectations will evolve, and your own understanding of what makes them successful will get sharper over time.
As a rule of thumb, plan on giving your model a full review and tune-up every 6 to 12 months. This check-in makes sure your definition of "healthy" is still accurate and tied to your business goals. Of course, if you start seeing a disconnect—like customers you thought were "healthy" suddenly churning—that's your signal to revisit the model much sooner. Staying nimble is everything. For more strategies on refining your retention efforts, you can explore the articles on the LowChurn blog.
Ready to stop guessing and start predicting? LowChurn connects to your Stripe account in one click, providing real-time customer health scores and an early warning system to prevent churn before it happens. See how much MRR you can save at https://www.lowchurn.com.