At its core, calculating customer lifetime value boils down to a simple truth: it's the total revenue you can reasonably expect from a single customer account. It’s not just about their first purchase, but every single transaction over their entire relationship with your business. For subscription models, a quick way to find this is by dividing your average revenue per user by your churn rate.
Why Customer Lifetime Value Is a Game Changer

Let's move beyond abstract metrics for a second. Customer Lifetime Value (CLV) is your strategic lens for sustainable growth, especially if you're running a SaaS or subscription company. It forces you to shift your focus from short-term gains to long-term health and profitability.
Imagine you have two customers. One signs up for your most expensive plan but cancels after just two months. The other starts on a basic tier, sticks around for years, and eventually upgrades. Which customer is truly more valuable? Initial revenue figures might point to the first one, but a CLV analysis reveals the second is the real champion for your business.
Focusing on What Truly Matters
When you start prioritizing CLV, you naturally start making smarter, more informed decisions across the entire organization. This one metric has a ripple effect, influencing how you spend your time and money.
- Marketing Spend: It tells you exactly how much you can afford to spend to acquire a new customer (your Customer Acquisition Cost, or CAC) and still come out ahead.
- Product Development: Understanding what your high-CLV customers love about your product gives you a clear roadmap for what to build or improve next to keep people loyal.
- Customer Support: It justifies investing in a top-notch support and success team. After all, keeping your most valuable customers happy is far cheaper than constantly finding new ones.
The core idea is simple but powerful: a high CLV is a sign of a healthy, scalable business. It proves you’re not just making one-off sales; you're building valuable, lasting relationships.
The Foundation of CLV Calculation
The traditional approach to calculating CLV hinges on three key pieces of data: Average Order Value (AOV), Purchase Frequency, and Customer Lifespan.
Think of an e-commerce retailer where the average order is $75, customers buy 8 times a year, and the average customer sticks around for 3 years. The gross CLV is a straightforward $1,800 ($75 x 8 x 3).
But that's not the whole story. If it cost $120 to acquire that customer and $30 per year in retention marketing, the net CLV drops to $1,590. This highlights just how crucial it is to factor in your costs to get a true picture of profitability. For a deeper dive into these variables, you can find more insights on CLV on Qualtrics.com.
Your Starting Point with Simple CLV
Ready to get your first CLV number without needing a data science degree? The simple CLV formula is the perfect place to start. It’s fast, only requires two core metrics, and gives you an immediate baseline for understanding what a customer is worth.
This approach is especially powerful for subscription and SaaS businesses where revenue is predictable and recurring. The whole calculation hinges on two numbers you’re probably already tracking: Average Revenue Per User and your Customer Churn Rate.
Finding Your Core Metrics
Before plugging anything into the formula, you need to grab these two key metrics from the same time period. A month is the most common window. The key here is consistency—if you use monthly revenue, you absolutely must use a monthly churn rate.
- Average Revenue Per User (ARPU): This is just the average revenue you get from one customer over that period. To get it, take your total monthly recurring revenue (MRR) and divide it by your total number of active customers. Simple as that.
- Customer Churn Rate: This is the percentage of customers who left or canceled their subscription during that same month. You find it by dividing the number of customers who churned by the total number of customers you had at the start of the month.
Once you have these two figures, you have everything you need for the most straightforward CLV calculation.
Putting the Simple CLV Formula into Practice
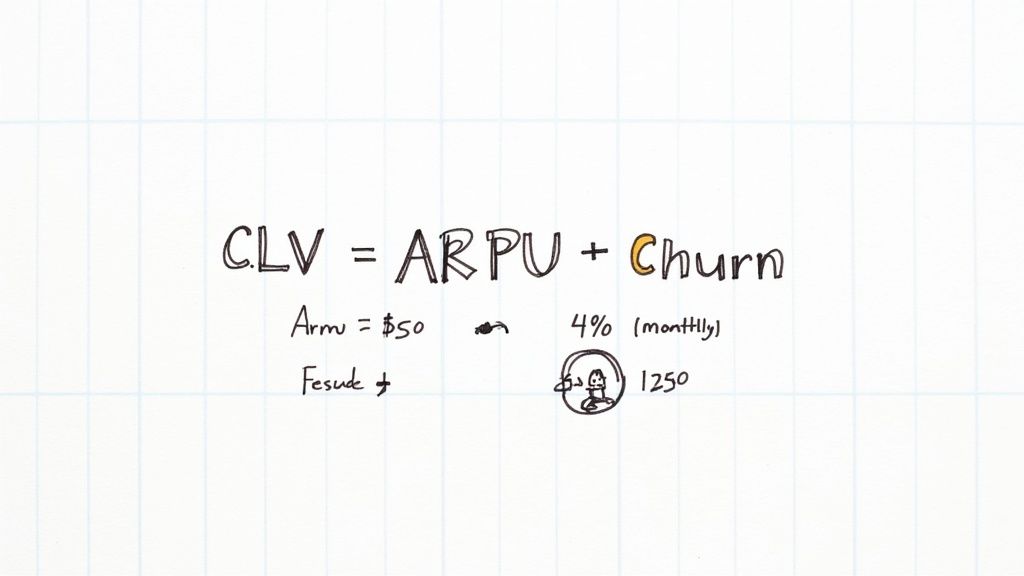
The formula itself is remarkably simple: CLV = ARPU / Customer Churn Rate. What this gives you is the expected total revenue from an average customer before they eventually churn.
Let’s walk through a real-world example. Imagine your SaaS business has these metrics for last month:
- Average Revenue Per User (ARPU): $50 per month
- Monthly Customer Churn Rate: 4% (or 0.04 as a decimal)
Now, let's just plug those into the formula: CLV = $50 / 0.04
The result is $1,250. This number tells you that, on average, a new customer is expected to bring in $1,250 in revenue over their entire time with your company.
This simple calculation instantly reframes how you see your customers. It's no longer about a single $50 payment; it's about a $1,250 long-term asset. This shift in perspective is fundamental to making smarter decisions about how much you spend on acquiring and keeping them.
The Limitations of This Approach
While this number is incredibly useful for a quick snapshot, it's important to know its limitations. The simple CLV model makes a big assumption: that both your ARPU and churn rate will stay the same forever. In reality, they almost never do.
It also doesn't factor in the costs of serving that customer (like support or server fees) or what it cost you to acquire them in the first place.
Think of this calculation as a fantastic starting point. It gives you gross revenue, not profit. It’s the foundational layer, and in the next sections, we'll build on it to get a much truer, more profitable picture of customer value.
CLV Calculation Models at a Glance
As you get more comfortable with CLV, you'll find that different models serve different purposes. The simple formula is a great start, but other methods can provide deeper, more actionable insights depending on the data you have and the questions you need to answer.
Here’s a quick comparison of the most common models to help you see where you might go next.
| CLV Model | Formula Concept | Best For | Pros | Cons |
|---|---|---|---|---|
| Simple CLV | ARPU / Churn Rate | Early-stage SaaS, quick estimates. | Very easy and fast to calculate. | Assumes static ARPU/churn; ignores costs. |
| Cohort CLV | Σ (Revenue from Cohort in Period N) | Analyzing user behavior over time. | Highly accurate for historical data. | Can't predict future behavior; requires clean data. |
| Margin-Adjusted CLV | (ARPU * Gross Margin %) / Churn Rate | Businesses focused on profitability. | Accounts for the cost of service (COGS). | Still assumes static rates; needs accurate margin data. |
| Predictive CLV | Complex models using historical data. | Mature businesses with rich datasets. | The most accurate forward-looking model. | Requires data science skills and significant data. |
This table shows that while the simple model is a powerful first step, layering in concepts like cohorts and gross margin will give you a much more nuanced understanding of your business's health.
Calculating CLV for True Profitability
It’s easy to get excited about big revenue numbers, but they don't always tell the whole story. The simple CLV formula gives you a powerful top-line figure, but it completely ignores a crucial piece of the puzzle: the cost of actually delivering your service. True profitability isn't about what customers pay you; it's about what you get to keep.
This is where your Gross Margin comes in. Think of it as the percentage of revenue left over after you've paid all the direct costs tied to earning that revenue. In the SaaS world, we often call this the Cost of Service, and it includes things you can't operate without.
For most subscription businesses, these costs typically include:
- Server hosting and infrastructure fees (e.g., AWS, Azure)
- Third-party software licenses needed to run your product
- Salaries for your customer support and success teams
If you ignore these costs, you get a dangerously optimistic view of your business. I've seen it happen: a high-revenue customer who constantly needs expensive support can actually be less profitable than a quiet, lower-revenue customer who never submits a ticket. Factoring in your gross margin is how you uncover who your truly valuable customers are.
Adjusting the Formula for Profit
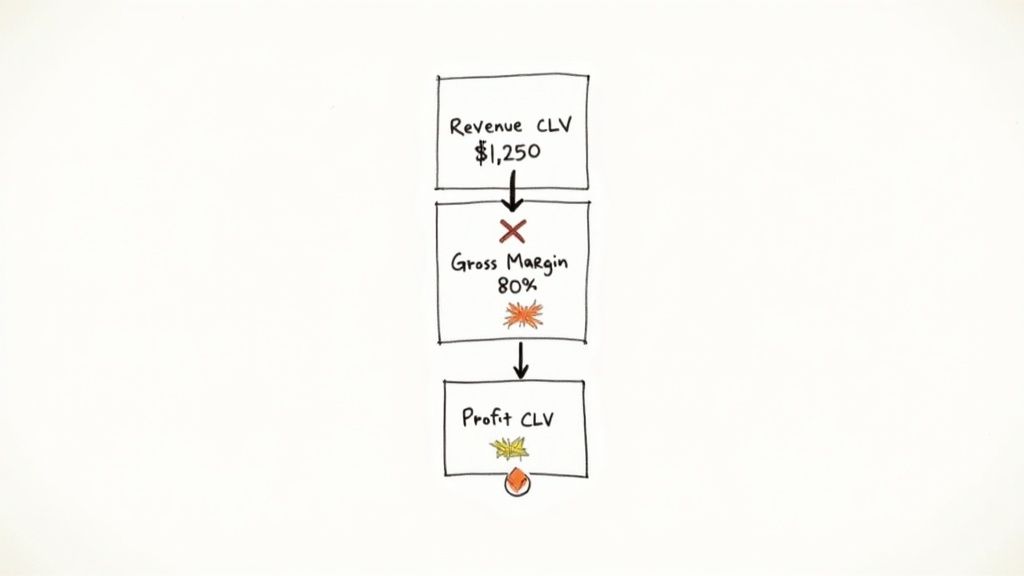
Getting to a more realistic, profit-adjusted CLV is surprisingly straightforward. You just multiply your simple CLV by your gross margin percentage. It's a small tweak to the formula, but it has a massive impact on your strategic thinking.
Let's go back to our last example, where we calculated a simple CLV of $1,250. Now, let's say your business runs on a healthy 80% gross margin. This means for every dollar in revenue, $0.20 goes straight to covering the direct costs of service, leaving you with $0.80 in gross profit.
Here’s what the adjusted calculation looks like:
Profit-Adjusted CLV = Simple CLV x Gross Margin % Profit-Adjusted CLV = $1,250 x 0.80
The new result is $1,000. That's a significant difference. This $1,000 figure gives you a much more sober and accurate picture of what that customer relationship is actually worth to your bottom line.
This simple shift from a revenue-first to a profit-first mindset is fundamental. It ensures you're spending marketing dollars and focusing retention efforts on acquiring and keeping customers who genuinely fuel your company's financial health.
This margin-adjusted view is critical for making sound financial decisions. It directly informs how much you can responsibly spend to acquire a customer (your CAC). A company with a high gross margin can afford a higher CAC than a business with razor-thin margins, even if their top-line CLV is identical.
Ultimately, this all ties back to customer loyalty; a better understanding of your margins helps you invest in the right places to improve your retention ratio formula, which in turn boosts long-term value. This is a non-negotiable step in learning how to calculate customer lifetime value for real-world impact.
Uncovering Trends with Cohort Analysis
A single, company-wide CLV number can be dangerously misleading. It mashes your best and worst customers together into a bland average, completely hiding the real stories playing out in your user base. To get to the truth, you have to segment. And that's where cohort analysis becomes your secret weapon.
A cohort is just a group of customers who share a common trait. Most of the time, that trait is when they signed up. So, everyone who joined in January is your "January Cohort." Everyone from February is the "February Cohort." Simple as that.
When you calculate CLV for each cohort individually, the blurry, averaged-out picture of your business suddenly snaps into high definition. You can finally start asking—and answering—the questions that a single CLV figure could never touch.
Why Comparing Cohorts Is a Game-Changer
The real magic happens when you line these cohorts up next to each other. All at once, you can see the direct impact of your decisions over time.
Did you roll out a major product update in March? Check if the March cohort sticks around longer and has a higher CLV than the February one. Experimented with a new LinkedIn ad campaign in Q3? Compare the lifetime value of those users to the cohort you acquired through organic search.
This is how your data comes to life. You might find that the LinkedIn campaign drove a ton of signups, but they churned out almost immediately, resulting in a pathetic CLV. At the same time, your slower-growing organic cohort might be full of loyal users who stick around for years, making them infinitely more valuable.
By isolating variables, cohort analysis gives you clear, undeniable proof of what’s working and what isn’t. It’s the difference between guessing and knowing, showing you exactly which acquisition channels and product changes actually build long-term value.
Reading a Retention Curve
One of the best ways to see cohort behavior is with a retention curve. This chart shows you what percentage of each cohort is still with you over time—Month 1, Month 2, Month 3, and so on. A steep nosedive means high churn and low CLV. A flatter curve is the goal; it signals strong retention and much healthier lifetime value.
Picture a graph with three distinct curves:
- The May Cohort: This one drops off a cliff, losing 40% of its users by the third month. Ouch.
- The June Cohort: After a small initial dip, this curve flattens out beautifully, holding on to 80% of its users by month three.
- The July Cohort: This curve looks even better than June's.
This immediately gets you asking the right questions. What happened in June and July? Maybe that's when you finally fixed your onboarding flow or launched a killer feature that got people hooked. This kind of visual feedback directly links your strategic moves to real-world results. Once you understand which behaviors lead to longer lifespans, you can dramatically improve your customer churn prediction models and give new users the support they need to succeed.
This segmented approach is a critical step in learning how to calculate customer lifetime value in a way that actually gives you something to act on. It turns CLV from a static, vanity metric into a dynamic tool for making your business better every single month.
Forecasting Future Value with Predictive CLV
Historical models like cohort analysis are great for understanding past behavior. But let's be honest, that’s like driving a car while only looking in the rearview mirror. To actually get ahead and steer your business effectively, you need to know what's coming.
This is where predictive CLV comes in. It’s all about shifting your focus from what customers have done to what they are likely to do.
Predictive models go way beyond simple averages for revenue and churn. They use machine learning to dig into the early behavioral signals—those subtle clues in how people actually use your product—to forecast their future potential with some serious accuracy. This lets you stop being reactive and start being proactive.
From Data Points to Future Champions
Instead of just waiting for a customer to churn and then wondering why, predictive CLV helps you spot the warning signs weeks or even months in advance. It analyzes key leading indicators to build a live, dynamic picture of each customer's health and potential value.
What kind of signals are we talking about?
- Product Engagement: How often are they logging in? Are they using the core features that lead to success?
- Feature Adoption: Have they moved beyond the basics and started exploring more advanced functionality?
- Support Interactions: Is the number or severity of their support tickets suddenly increasing? That’s often a red flag.
- Expansion Signals: Are their usage patterns bumping up against the limits of their current plan?
Think about it this way: a customer on your basic plan might be showing usage patterns that strongly correlate with accounts that typically upgrade within six months. This kind of foresight is a game-changer. It allows you to nurture that high-potential account with targeted guidance, making sure they get maximum value and see a clear, compelling reason to upgrade. It’s no longer just guesswork; it's data-driven anticipation.
Predictive CLV helps you identify your future champions before they even know it themselves. It's about seeing the $10,000 account hidden inside a $1,000 customer and having a plan to get them there.
In practice, this is incredibly powerful. For instance, a new SaaS customer might sign a $5,000 contract, but by analyzing their usage data and comparing them to similar accounts, you might forecast their value to grow to $15,000 within two years. By tracking metrics like Average Revenue Per User (ARPU), churn risk, and specific engagement scores, you can effectively separate your high-value, high-potential customers from lower-touch accounts. For a deeper dive into these forecasting methods, you can explore more CLV insights on Salesforce.com.
This chart perfectly illustrates how these insights can shape your strategy, comparing the CLV of customers acquired through paid ads versus those from organic search.
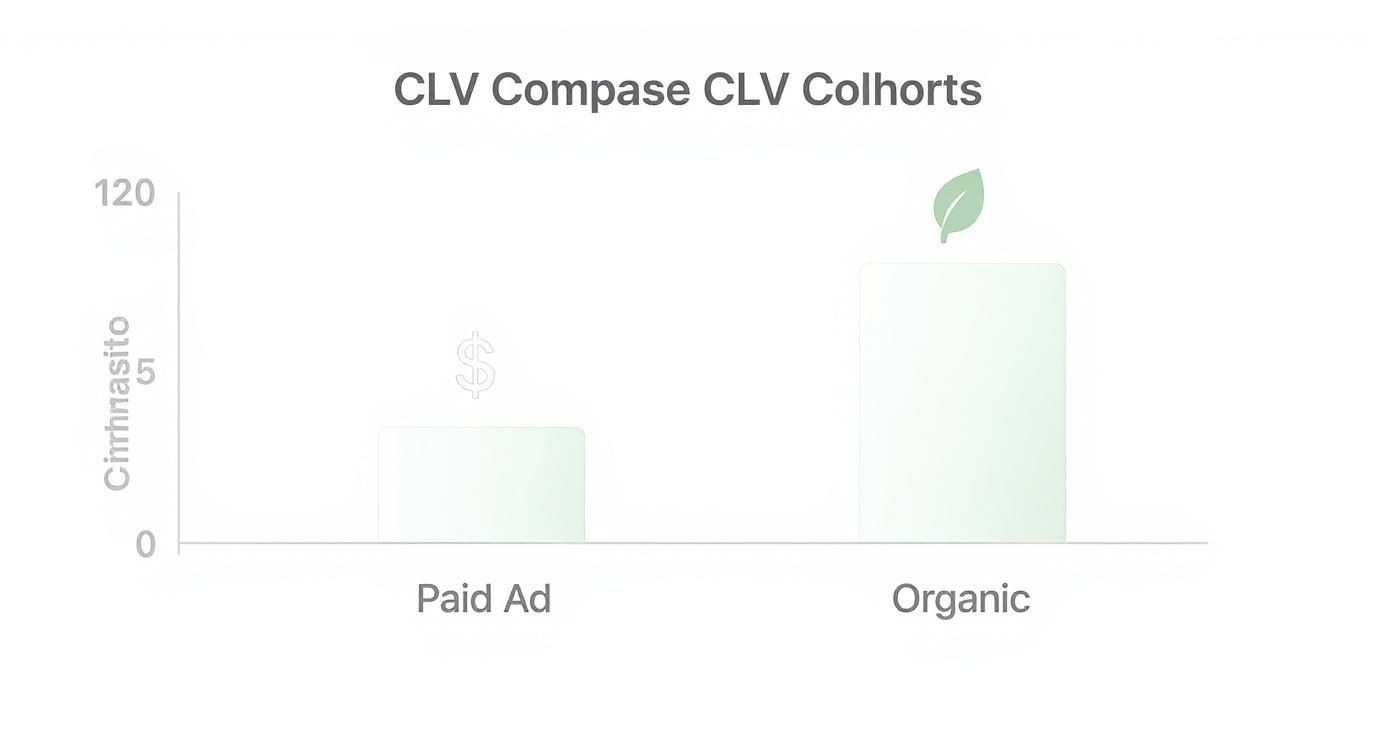
As you can see, while paid ads might bring in a higher volume of users initially, the customers who find you organically tend to stick around longer and have a significantly higher long-term value. This is exactly the kind of insight that helps you invest in the right channels for sustainable, profitable growth.
Common CLV Calculation Mistakes to Avoid
Getting the math right is just the first step. The real challenge with CLV is avoiding the common traps that can make your final number totally misleading. I’ve seen teams make these same mistakes over and over, leading to flawed strategies.
Let's start with the biggest one: treating all your customers like one big, happy family.
Lumping Everyone Together
An "average" CLV that mixes your enterprise whales with your small, self-serve accounts is worse than useless—it’s dangerous. It papers over the crucial differences that actually drive your business forward.
Imagine you have a group of customers from paid ads with a $1,500 CLV and another from organic search with a $4,000 CLV. An average might tell you your CLV is $2,750, leading you to believe both channels are performing similarly. In reality, one is far more valuable.
You have to segment. Break down your CLV by:
- Acquisition channel (paid, organic, referral)
- Pricing tier (basic, pro, enterprise)
- Company size or industry
This is where the real insights are hiding.
Forgetting About Costs
Another classic error is getting so focused on top-line revenue that you completely ignore the costs involved in keeping a customer happy. A high-revenue client who constantly needs expensive, hands-on support could easily be less profitable than a quiet, low-touch customer.
Always factor in your gross margin to get a profit-adjusted CLV. It gives you a much clearer picture of who's actually contributing to your bottom line.
A single, company-wide CLV is a vanity metric. The real power comes from segmented, profit-adjusted calculations that show you exactly which customer relationships are fueling sustainable growth.
Using Mismatched Timeframes
This one sounds simple, but it trips people up all the time. You have to be consistent with your time periods.
If you're using a monthly ARPU (Average Revenue Per User), your churn rate must also be monthly. Don't grab a monthly revenue figure and pair it with an annual churn rate. It'll throw your entire calculation off, giving you a number that looks fantastic on a spreadsheet but means absolutely nothing in the real world. Consistency is everything here.
A Few Common Questions About CLV
As you start putting these CLV calculations to work, some practical questions always come up. Let's tackle the ones I hear most often.
How Often Should I Recalculate CLV?
There's no single magic number here, but a quarterly calculation is a great place to start. It’s frequent enough to catch important trends—like the impact of a new marketing campaign or a product update—without getting lost in the noise of daily or weekly changes.
If your startup is moving at a breakneck pace or you just rolled out a major feature, you might want to look at it monthly. This gives you much faster feedback on whether your big bets are paying off. The most important thing is to pick a rhythm and stay consistent so you can make meaningful comparisons over time.
What's a Good CLV to CAC Ratio?
For most SaaS companies, the gold standard is a CLV to CAC (Customer Acquisition Cost) ratio of 3:1 or higher. In simple terms, this means for every dollar you spend bringing a new customer in the door, you should expect to get at least three dollars back over their lifetime.
Think of it this way: A ratio below 1:1 is a flashing red light—you're losing money on every customer you sign. If you're hovering between 1:1 and 3:1, you might be breaking even, but there's little room for error. It's a sign that you need to optimize either your acquisition costs or your customer value.
Does CLV Actually Change Over Time?
Absolutely. In fact, it should change. Think of your CLV as a living, breathing metric that reflects the health of your business, not some static number you calculate once and forget.
It will naturally shift as you improve your product, tweak your pricing, or nail your customer onboarding flow. This is exactly why tracking CLV with cohort analysis is so powerful. It doesn't just tell you the number; it helps you connect the dots between your strategic decisions and the real financial results.
If you're looking for ways to boost customer loyalty and, in turn, your CLV, the retention strategies on the LowChurn blog are a great resource.
Ready to stop guessing which customers are about to churn? LowChurn uses AI to predict cancellations 7–30 days in advance, giving you the time and tools to save valuable MRR. Get started in under 60 seconds.