To gauge how many clients slip away, divide the number of customers you lost by your starting count, then multiply by 100%. This simple formula—Lost ÷ Start × 100%—gives you a clear retention snapshot.
Quick Overview Of Calculating Customer Churn Rate
These three approaches adapt to different reporting needs. Pick the one that aligns with your cadence and objectives.
- Standard Churn: (Lost ÷ Start) × 100% for a straightforward monthly or quarterly health check
- Cohort Churn: (Lost cohort ÷ Cohort size) × 100% to track signup groups and spot trends
- Revenue Churn: (MRR lost ÷ Starting MRR) × 100% when you need to understand dollar-value impact
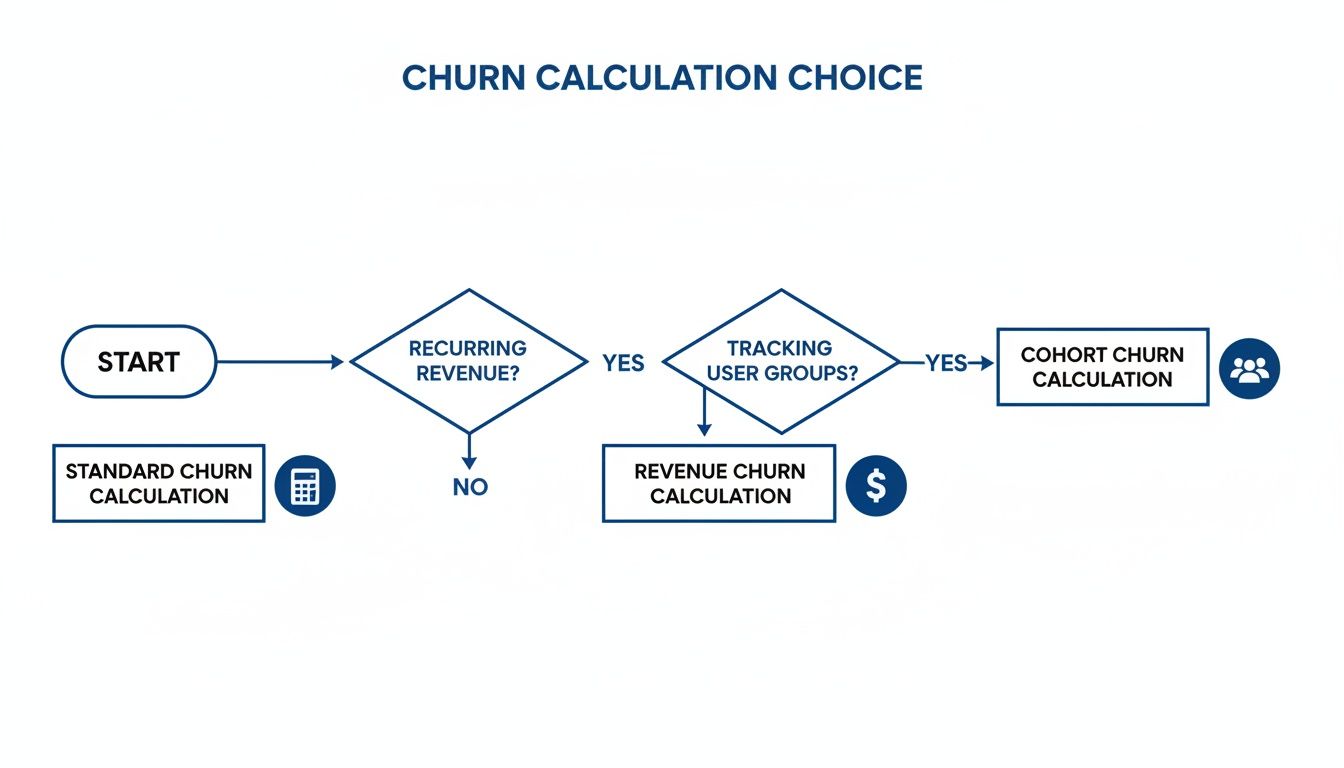
Infographic Decision Tree
The chart below illustrates when standard, cohort, or revenue churn makes the most sense. It’s a quick guide for dialing in your reporting style.
Summary Of Churn Calculation Methods
Here’s a side-by-side look at the core formulas, plus guidance on when each shines.
| Method | Formula | When To Use |
|---|---|---|
| Standard | (Lost ÷ Start) × 100% | Stable customer base—monthly checks |
| Cohort | (Lost cohort ÷ Cohort size) × 100% | Analyze drop-offs by signup date |
| Revenue | (MRR lost ÷ Starting MRR) × 100% | Focus on the financial hit |
Keep this comparison handy as you decide which metric best fits your stage of growth.
- Clean Your Data before crunching churn numbers to avoid skewed results
- Define Your Reporting Window up front so comparisons stay consistent
Next up, we’ll dive into detailed formulas, spreadsheet layouts, and sample SQL snippets to automate these churn calculations.
Understanding Key Terms
Before you start crunching numbers, make sure everyone agrees on the basic definitions.
Customer Churn counts how many accounts cancel over a certain timeframe.
Revenue Churn measures the MRR you’ve lost compared to where you began.
Gross Churn ignores any upgrades, while Net Churn deducts expansion revenue.
Your contract length sets the window for measurement. Shorter cycles reveal sudden drop-offs. Annual agreements tend to smooth out those monthly swings.
Examples Of Reporting Windows
A quick overview of two common setups:
| Scenario | Period | Data Points |
|---|---|---|
| Freemium App | Monthly | Signups, cancellations |
| Enterprise Contract | Annual | Renewals, downgrades |
Handling Mid-Period Signups
When someone signs up halfway through the month, simply counting them in your starting base can artificially boost churn.
A couple of ways to tackle this:
- Prorate active days in your denominator
- Use an average customer count for the period
"Choosing consistent definitions upfront prevents misinterpretation down the line."
Promotional credits, trial accounts and prorations all add wrinkles to both customer and revenue churn metrics. Nail down clear rules before you begin:
- Standardize each reporting window
- Track trial conversions separately
- Decide how to treat upgrades or partial refunds
With these definitions locked in, your retention numbers will tell a truer story.
Common Mistakes To Avoid
It’s easy to overstate churn by counting trial expirations as cancellations. Likewise, ignoring mid-contract downgrades hides critical usage shifts.
Prevent these slip-ups by:
- Clearly defining churn start and end points
- Sharing reporting rules with finance, product and customer-success teams
Accurate churn analysis starts with shared, unambiguous terminology.
Basic Formulas And Adjusted Methods
When you want a quick snapshot of subscriber losses, the standard churn formula is your starting point. It’s simply the number of customers lost divided by the count you began the period with.
Picture kicking off a quarter with 500 customers and seeing 20 cancellations by the end. The churn rate is 4.0% ((20 ÷ 500) × 100). This aligns with advice from Stripe and Wall Street Prep. For a detailed walkthrough, see Stripe’s churn guide.
To set this up in your dashboards:
- Record your Start Count (active customers on day one)
- Track your Lost Count (total cancellations in the period)
- Divide lost by start and multiply by 100
- Label periods clearly to avoid misaligned reporting windows
- Display both raw counts and percentages for deeper insight
Comparison Table
| Method | Denominator | Best For |
|---|---|---|
| Standard | Start Customers | Steady growth |
| Average | Average of Start and End | Volatile periods |
Imagine a SaaS team starting January with 1,200 accounts and losing 60 by month’s end. That yields a 5% churn rate.
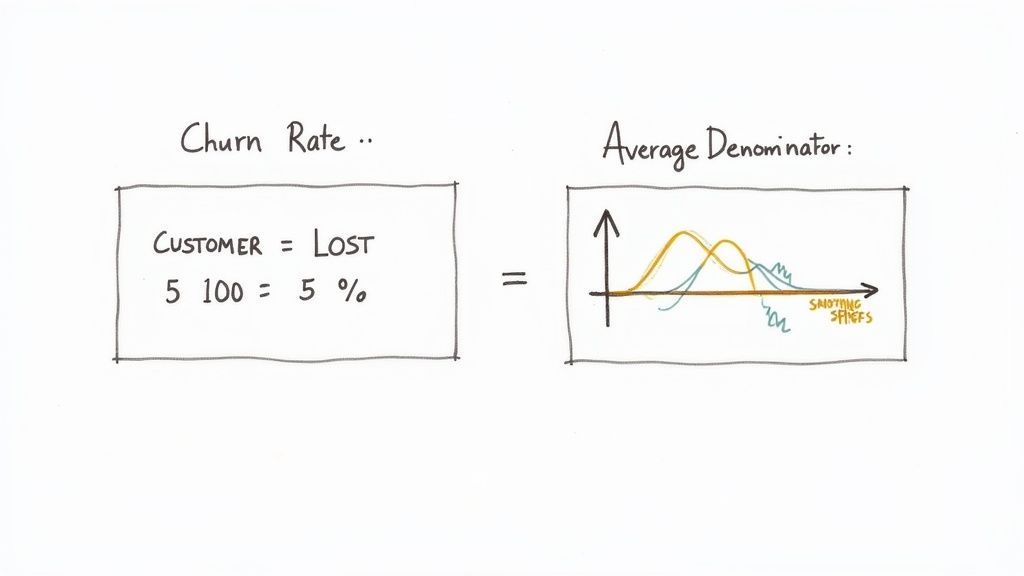
This chart makes it clear: losing ten customers from a small base hits your churn hard, more than the same loss would later.
Average Denominator Method
When signups and cancellations overlap, your churn numbers can bounce around. The average denominator approach smooths those peaks and valleys.
In spreadsheets or SQL queries, you simply:
- Calculate Average Customers as (Start Customers + End Customers) ÷ 2
- Compute Churn Rate (%) as (Customers Lost ÷ Average Customers) × 100
For instance, starting with 500 accounts, ending with 480, and losing 20, your average is 490. That translates to a churn rate of 4.08%.
Choosing The Right Method
Use the simple formula when your subscriber count stays within about 10% of its starting point. If your base swings more widely, switch to the average method for a clearer picture.
Smoothing out customer swings helps stakeholders focus on real trends rather than noise.
Whatever you pick, stick with it across reports. Consistency builds trust with executives and investors.
Key Considerations And Pitfalls
- Document Your Formula so everyone knows if you’re using start or average counts
- Automate Your Reports by embedding calculations directly in dashboards or SQL queries
- Annotate Key Events like campaigns, trials and price changes to explain sudden shifts
Pros of Simple Churn
- Quick To Calculate and share in executive briefings
- Best for stable customer bases with minimal headcount change
Pros of Average Method
- Smooths Volatility during overlapping signups and cancellations
- Ideal when your subscriber count swings more than 10%
Common Pitfalls To Avoid
- Counting trial expirations as cancellations
- Ignoring mid-period plan upgrades and downgrades
- Mixing up date boundaries across teams
Next Steps For Reporting
Set alerts for when churn crosses critical thresholds. Review your chosen method quarterly and update your team on any definition tweaks.
Cohort And Revenue Churn Calculations
Cohort analysis breaks your user base into signup groups so you can see exactly when people drop off. Instead of a flat monthly churn rate, you’ll spot patterns tied to feature launches, seasonality, or onboarding tweaks.
When a SaaS team saw a 15% churn jump in their Q3 signups after a design overhaul, they dove into bug reports and interviews. Two months later, targeted fixes and proactive check-ins swung retention up by 8 percentage points.
Cohort Setup And Tracking
Group customers by the month they signed up and then:
- Chart month-over-month retention rates
- Highlight declines in a heatmap or line graph
- Flag any sudden dips after releases or campaigns
Seeing a sudden fall in Month 2 retention? That’s your cue to review welcome flows or hunt down confusing UI elements.
Here’s what a simple cohort table looks like:
| Cohort Month | Month 0 | Month 1 | Month 2 | Month 3 |
|---|---|---|---|---|
| Jan 2023 | 100% | 92% | 88% | 83% |
Calculating Revenue Churn
Customer counts tell one story, but MRR churn reveals the money side. To find it, divide the lost recurring revenue by the starting recurring revenue, then multiply by 100. For instance, if you begin a month with $100,000 MRR and lose $8,000 to cancellations and downgrades, your revenue churn is:
($8,000 ÷ $100,000) × 100 = 8.0%.
Discover more on Chargebee’s churn-rate breakdown.
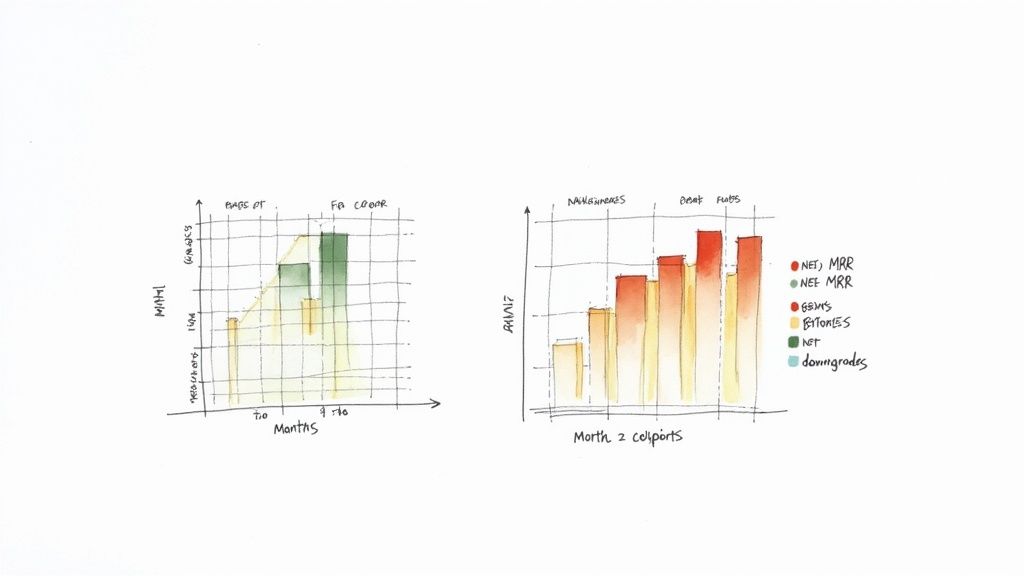
Net MRR churn factors in upgrades and expansions, giving a fuller view of account growth and contraction.
Customer Versus Revenue Churn
Before you decide where to focus, it helps to compare the two metrics side by side. Below is a quick reference to spot which metric reveals your biggest blind spots.
Customer Versus Revenue Churn
See how each metric differs in focus, formula, and business impact so you can pick the right lens.
| Metric | Formula | Focus | Impact |
|---|---|---|---|
| Customer Churn | (Lost Customers ÷ Start Customers) × 100 | Number of accounts lost | Shows headcount decline |
| Gross MRR Churn | (MRR Lost ÷ Starting MRR) × 100 | Downgrades & cancellations | Highlights revenue at immediate risk |
| Net MRR Churn | (MRR Lost − Expansion MRR) ÷ Starting MRR × 100 | Total revenue movement | Reflects true health after upsells |
Comparing these side by side points you toward your first intervention. If gross churn spikes but net churn stays low, expansion is covering your exits.
You might be interested in our guide on how to calculate customer lifetime value for deeper financial context.
Practical Action Plan
- Build cohort reports in Excel, your BI tool or Looker
- Connect Stripe exports to track starting and ending MRR each period
- Run a SQL query to gauge revenue churn, for example:
SELECT start_mrr, lost_mrr, (lost_mrr::float / start_mrr) * 100 AS revenue_churn_pct FROM monthly_mrr; - Hold a monthly meeting to review both cohort and MRR churn figures
- Drill down on high-risk segments and large-value departures
A reliable cadence makes retention issues pop up long before they sink your growth. Tracking these metrics in LowChurn helps you identify at-risk groups and launch targeted campaigns right away.
Implementing Calculations In Spreadsheets And SQL
Crunching churn numbers every month can feel like Groundhog Day. Automating those calculations not only frees up your calendar, it also slashes the chance of human error.
Spreadsheets give you instant visibility the moment you plug in counts, cancellations or MRR figures. And if you structure your file right, period, cohort and rolling churn figures update themselves without any extra tinkering.
Setting Up Your Spreadsheet
- Label clear input fields for Start Count, Lost Count, End Count, Average Customers and Starting MRR.
- Build formulas that recalculate automatically whenever you add new rows.
- Use named ranges so everyone on your team knows exactly which cells feed each chart.
- Link your graphs directly to those named ranges—no hunting for source data.
To calculate period churn, divide Lost Count by Start Count and multiply by 100. Cohort churn is simply Lost Cohort over Cohort Size, also times 100. Rolling churn tracks a moving window—sum three periods of losses, divide by the average base over those same three months, and multiply by 100.
Spreadsheet Formula Examples
| Calculation | Formula |
|---|---|
| Period Churn | =B2/A2*100 |
| Cohort Churn | =C2/D2*100 |
| Rolling Churn | =SUM(B2:B4)/AVERAGE(A2:A4)*100 |
These exact formulas work in both Excel and Google Sheets—just copy, paste and watch the numbers flow.
Querying Your Data With SQL
If you’d rather let SQL power your dashboards in Looker, Metabase or Chartio, a simple query against your subscriptions table will do the trick. For example:
SELECT
DATE_TRUNC('month', created_at) AS period,
COUNT() FILTER(WHERE status = 'active' AND month_start) AS start_customers,
COUNT() FILTER(WHERE status = 'canceled' AND month_cancel) AS lost_customers,
(COUNT() FILTER(WHERE status = 'canceled')::float /
COUNT() FILTER(WHERE status = 'active')) * 100 AS churn_rate
FROM subscriptions
GROUP BY period;
Key Insight: Automating queries ensures consistency across every reporting tool you use.
A few quick best practices:
- Clearly name your date fields so there’s no confusion.
- Calculate cohorts with
DATE_TRUNC('month', …)andGROUP BY. - Leverage window functions like
LAG()when you build rolling numbers.
Visualizing SQL Churn Sample
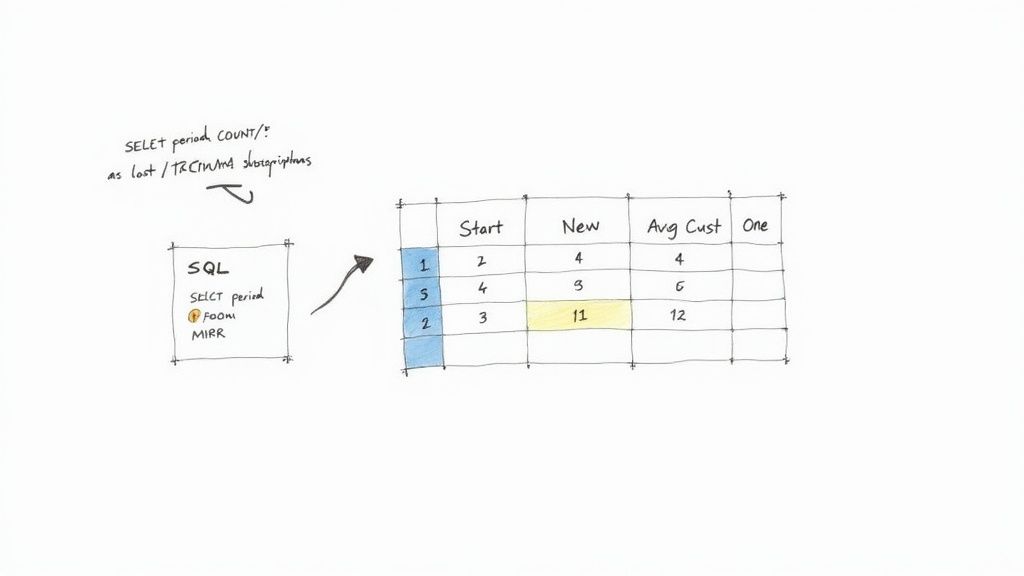
That snapshot highlights a 5.2% churn spike in November—an early warning that it’s time to investigate seasonal drop-off.
You might be interested in exploring how dynamic health scores complement churn analysis in real time. Learn how to integrate customer health signals in your churn workflows in our article on customer health score.
Before you push these queries into Looker or Metabase, test them against historical churn events and validate your counts against Stripe exports. This extra step keeps your numbers rock solid.
SQL Snippet For Cohort Churn
To track first-month cohort retention and churn trends:
SELECT
cohort_month,
COUNT() FILTER (WHERE status = 'active') AS active_at_month1,
COUNT() FILTER (WHERE status = 'canceled') AS churned_in_month1
FROM (
SELECT *,
DATE_TRUNC('month', signup_date) AS cohort_month
FROM subscriptions
) sub
GROUP BY cohort_month;
This query shows how each signup group performs after one month—perfect for spotting cohorts that need extra attention.
Test cohort windows against known signup batches to validate your logic.
Finally, schedule these queries to run weekly. Email the CSV outputs or feed them straight into your dashboard. With continuous monitoring in place, you’ll catch churn spikes early and devote your energy to retention strategies instead of manual number-crunching.
Handling Subscription Nuances And Measuring Accuracy
Subscription quirks can throw your churn numbers off balance. A single mid-cycle cancellation might look like a full churn event even though the customer used half their billing period.
Prorations and usage credits add another layer of complexity. Downgrades, upgrades and freebies all need clear rules to prevent counting the same customer as churned and expanded.
- Normalize prorations into full-period equivalents
- Separate free trials from paid cancellations
- Tag mid-period plan changes by net MRR impact
Data Hygiene Best Practices
Duplicate or missing records inflate churn rates without you noticing. Time zone inconsistencies blur period boundaries, and skipped event imports hide real cancellations.
- Deduplicate subscription IDs to stop double counting
- Unify timestamps under one time zone
- Backfill missing events for cancellations or renewals
Top Data Cleaning Checklist
- Verify unique customer keys
- Confirm event completeness
- Align billing and usage records
Whenever customer counts swing wildly, try an adjusted churn formula. Divide lost customers by the average number of customers at the start and end of a period for a steadier metric.
Learn more about this method on Moxo
Measuring Accuracy In Stripe Workflow
Stripe’s billing engine and webhooks power your churn reports, so sync failures can tip your charts by hours. Staying on top of retries and export audits keeps the numerator and denominator solid.
Check out our guide on retention ratio formula to balance churn and retention figures.
- Log webhook retries and flag errors
- Compare Stripe exports with CRM data monthly
- Use consistent event timestamps for period start and end
Key Insight Real-time data hygiene lays the groundwork for reliable churn analysis.
With clean data, you’ll see the real reasons customers leave. Set up alerts when churn hits critical thresholds and jump on issues fast.
LowChurn integrates with Stripe to surface accurate, real-time churn rates and health scores. Explore how it can help you catch and fix churn before it becomes a problem.
Customer Churn Rate FAQs
When you’re staring at a dashboard full of dates, cancellations and proration credits, things can get messy fast. This FAQ bundles the real-world quirks into tidy answers so you spend more time acting on insights and less time cleaning data.
Consistent definitions prevent misaligned reports and save hours of audit work.
What Counts As A Lost Customer
In plain terms, a lost customer is simply an account that was active on day one and gone before the period wraps up. Don’t include anyone who started after your reporting window or those grandfathered into legacy plans.
For instance, one SaaS team decided to pull out legacy free trial accounts from their churn formula. That adjustment knocked 3 percentage points off their reported churn—and finally aligned their numbers with what sales was seeing.
When To Use Revenue Churn Instead Of Customer Churn
If every customer paid roughly the same fee, tracking headcounts works fine. But once you introduce multiple tiers, enterprise discounts and mid-cycle adjustments, dollar-based churn tells a more accurate story.
Finance teams I work with often spot 12% revenue churn even when customer churn hangs at 5%. Those big-ticket cancellations and downgrades slip right through a purely headcount lens.
| Churn Type | When To Use |
|---|---|
| Customer Churn | Stable base, focus on account count |
| Revenue Churn | Tiered pricing, large enterprise |
Here are a couple of practical pointers:
Handling Mid-Period Cancellations
Record the exact cancellation date and convert partial months into full-period equivalents before you do any arithmetic.Choosing The Right Denominator
When your headcount swings more than 10%, average the starting and ending populations. This smooths out sudden spikes or drops.
Key Insight: Adjusted denominators reveal true activity trends instead of seasonal noise.
Common Mistakes To Avoid
- Treating trial expirations as churn. It inflates your rate and can provoke needless alarms.
- Overlooking prorated credits or plan downgrades. Those hidden moves often tell the real customer story.
Ready to predict cancellations before they happen? Try LowChurn and boost renewal rates.