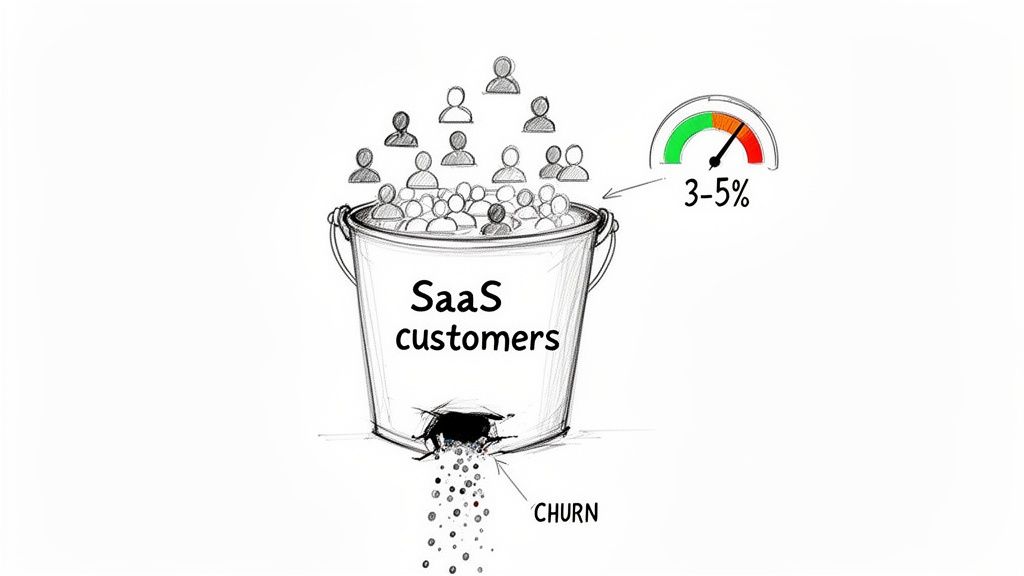
Everyone in SaaS loves to talk about churn, and you'll often hear a blanket "good" monthly churn rate is somewhere between 3-5%. But honestly, that number is almost useless without context. It’s like saying a "good" speed for a vehicle is 60 mph—it's great on a highway but a disaster in a school zone.
The best way to think about churn is as a hole in a bucket you’re constantly trying to fill with new customers. A 3-5% leak might seem small, but it can drain your revenue faster than you can pour it in. The real question isn't "what's a good churn rate?" but "what's a healthy churn rate for my business?"
What Is a Good SaaS Churn Rate?
While that 3-5% monthly churn rate gets tossed around a lot, treating it as a one-size-fits-all target is a trap. The reality is far more nuanced. What’s considered acceptable churn depends entirely on who you're selling to, what your price point is, and how mature your company is.
Think about it: an early-stage startup selling a $20/month tool to small businesses might be perfectly fine with a 5% monthly churn while they're still figuring out product-market fit. But for a well-established enterprise platform with six-figure contracts? That same 5% churn would be a full-blown crisis. Their customer acquisition costs are massive, and losing even one account is a huge blow.
Understanding Churn Benchmarks by Segment
To get a real sense of how you're doing, you need to stop looking at a single number and start comparing yourself to businesses that actually look like yours.
Let's dig into some more specific data. In 2025, the overall average monthly churn rate for SaaS companies was 4.1%. But breaking that down tells a more interesting story: 3.0% of that was voluntary churn (customers choosing to cancel), and 1.1% was involuntary churn (think failed credit card payments).
The numbers also shift between B2B and B2C models. B2B SaaS tends to have stickier customers, with an average voluntary churn of 3.5%, while B2C is a bit higher at 4.04%. You can explore more SaaS churn rate benchmarks to see just how deep these differences go.
The most dramatic differences appear when looking at price point. SaaS products with a low Average Revenue Per User (ARPU) under $25 per month experience a staggering 6.1% monthly churn. Conversely, high-end plans over $1,000 ARPU see churn drop to just 1.8%.
This data makes one thing crystal clear: the more a customer invests in your product—financially and operationally—the stickier they become. High-ticket B2B software often gets deeply woven into a company's daily operations, making the pain of switching to a competitor enormous.
SaaS Churn Rate Benchmarks at a Glance
For a quick reference, here’s a summary of how churn rates vary across different SaaS segments. This table helps put that generic 3-5% figure into perspective.
| SaaS Segment | Average Monthly Voluntary Churn | Key Influencing Factor |
|---|---|---|
| Overall SaaS Average | 3.0% - 5.0% | A broad baseline, but heavily skewed by model. |
| B2C SaaS | ~4.04% | Higher volume, lower switching costs. |
| B2B SaaS | ~3.5% | Deeper integration into business workflows. |
| Low ARPU (<$25/mo) | ~6.1% | Customers have less "skin in the game." |
| High ARPU (>$1k/mo) | ~1.8% | High switching costs and strategic importance. |
As you can see, context is everything. A high-ARPU enterprise solution and a low-cost B2C app are playing two completely different games when it comes to retention.
Moving Beyond a Single Number
At the end of the day, a "good" churn rate is one that allows your business to grow sustainably. If your customer acquisition can't keep up with your churn, you're on a treadmill to nowhere.
Your real goal should be to find the churn rate that is healthy for you. That means moving past averages and getting to the "why" behind your cancellations. Is your onboarding process confusing? Are you missing a killer feature your competitors have? Or are you simply attracting the wrong type of customer in the first place? Answering these questions is the first step toward building a retention strategy that actually works.
The Different Ways to Measure Churn
Before we can talk about fixing churn, we need to be crystal clear on what we're actually measuring. Just saying your "churn rate is 5%" is a bit like a doctor telling you your temperature is "a little high." It's a starting point, but it doesn't give you the full story.
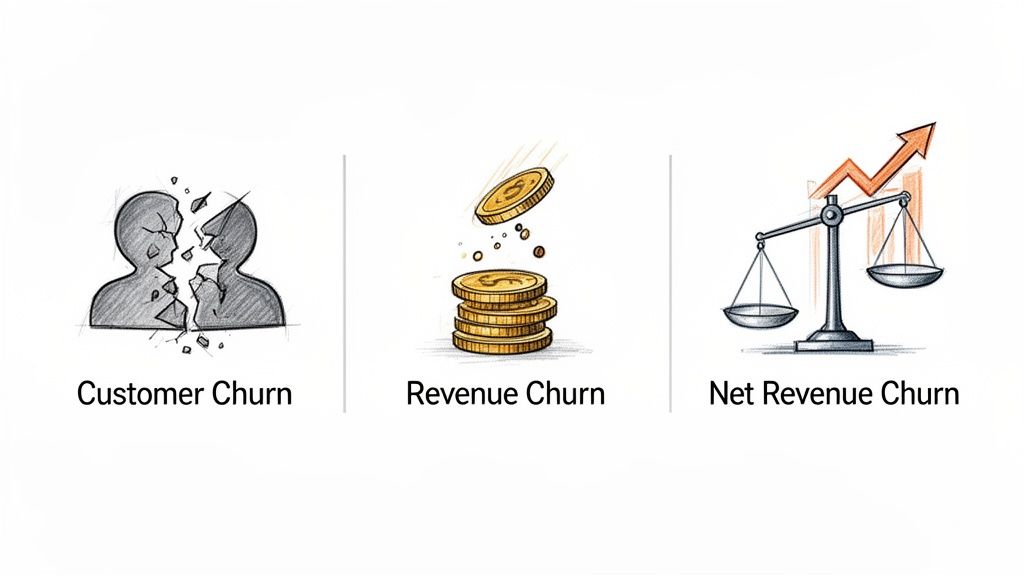
A single, generic churn number misses the critical context. Did you lose 5% of your customers, or 5% of your revenue? Were they small accounts or your biggest enterprise clients? To get a real diagnosis of your business's health, you have to look at churn from a few different angles. Each one tells a unique and vital part of your retention story.
Customer Churn: The Headcount
Customer Churn, which you'll also hear called Logo Churn, is the most basic metric. It answers one simple question: how many customers did we lose this month?
It's the number most people jump to first. You calculate it by dividing the number of customers who canceled by the total number you had at the start of the period.
So, if you began the month with 1,000 customers and 50 left, your customer churn rate is 5%. This is a useful number for understanding the sheer volume of people leaving, but it has a massive blind spot—it treats every single customer as equal.
Gross Revenue Churn: The Financial Bleeding
This is where things get a lot more real. Gross Revenue Churn (or Gross MRR Churn) measures the actual monthly recurring revenue (MRR) that walked out the door with those canceled subscriptions. Crucially, it only looks at the losses, completely ignoring any new revenue or upgrades from your remaining customers.
This metric is powerful because it puts a dollar amount on the damage.
Analogy: Think of it like owning an apartment building. Customer Churn tells you two tenants moved out. Gross Revenue Churn tells you it was the tenant in the luxury penthouse, not the one in the tiny studio. The financial hit is completely different.
Losing ten small businesses paying $20/month ($200 in lost MRR) is a problem. Losing one enterprise client paying $2,000/month is a crisis. Gross Revenue Churn exposes the true monetary weight of your losses and gives you a much clearer sense of urgency.
For a deeper dive, check out our guide on the different ways of calculating churn rate.
Net Revenue Churn: The Ultimate Health Metric
Finally, we get to Net Revenue Churn. This is the metric that gives you the most complete, insightful view of your business's health. It starts with the revenue you lost (Gross Revenue Churn) and then subtracts any new revenue you gained from your existing customers through upgrades, add-ons, and other expansions.
Let's break down the formula:
Net Revenue Churn Rate = [(MRR Lost from Churn & Downgrades) - (Expansion MRR from Upgrades)] / Starting MRR
This single percentage tells you if the growth within your current customer base is powerful enough to overcome the revenue you're losing.
The holy grail for any SaaS business is to achieve negative Net Revenue Churn. This is the magic moment when the new revenue from your happy, growing customers is greater than the revenue you lose from those who cancel. When you hit this milestone, your business grows automatically from your existing customer base alone—before you even sign a single new logo. It’s the clearest sign of a healthy, sticky product and a scalable business model.
How Your SaaS Churn Rate Stacks Up Against Industry Benchmarks
So, you know your churn rate. That's a great first step. But the real question is, is it good? That's where benchmarks come in, and let me tell you, the generic 3-5% monthly churn figure everyone throws around is almost uselessly vague.
A healthy churn rate is never a one-size-fits-all number. It depends entirely on who you sell to, how much they pay, and how mature your business is.
Think of it this way: you wouldn't compare the lap times of an F1 car to a family sedan, right? They're both cars, but they operate in completely different worlds with wildly different performance expectations. The same logic applies to a high-volume B2C app versus a high-touch enterprise platform.
The Great Divide: B2B vs. B2C Churn
The first and most important line to draw in the sand is between businesses selling to other businesses (B2B) and those selling directly to consumers (B2C).
- B2C SaaS: These companies just naturally have higher churn, often landing in the 6.5–8% monthly range. The stakes are lower for individual users, switching products is easy, and a few dollars a month can make a big difference.
- B2B SaaS: B2B products tend to be much stickier. Once a tool is woven into a company's daily workflow, ripping it out becomes a massive, expensive headache. This reality keeps churn rates lower, typically below 5% per month.
This distinction is everything. If you run a B2C subscription app, a 7% monthly churn might be perfectly fine. But for a B2B platform, that same number would be a five-alarm fire.
Churn Benchmarks by Company Size and Stage
As a SaaS company gets older and smarter, its churn rate should naturally go down. What’s considered normal for a scrappy startup is completely different from what’s expected of an established market leader.
Early-stage startups still nailing their product-market fit can expect higher churn, often hovering around 5-7% monthly. This isn't a failure; it's a natural part of figuring things out. You're casting a wide net and learning which customers stick and which ones don't.
Once a company finds its groove, churn rates begin to stabilize and fall. For most small and medium-sized B2B SaaS businesses, a healthy monthly churn is between 3-5%. As you move upmarket, that number drops to 1.5-3% for mid-market, and for enterprise-focused companies, it can be as low as 1-2%. The absolute best-in-class even get below 1%.
Key Insight: Lower churn isn't just about having a better product; it's a direct reflection of having a better customer fit. Mature companies are simply better at attracting and keeping their ideal customers, which leads to more stable, long-term relationships.
How ARPU Changes the Churn Game
Maybe the single most reliable predictor of churn is your Average Revenue Per User (ARPU). The more a customer pays you, the less likely they are to leave. It’s a pattern that holds true across the entire industry.
High-ARPU customers churn at lower rates because the product is usually deeply embedded in their operations. There was a bigger buying committee, a longer sales process, and more organizational buy-in. It's not something they can just swap out on a whim.
On the flip side, low-priced products have a very low barrier to exit. A customer might sign up to experiment, and if they don't see value immediately, they're gone.
To give you a clearer picture, let's look at how churn benchmarks break down across different company profiles.
Detailed Monthly Churn Rate Benchmarks by Company Profile
The table below provides a more granular look at what's considered an "acceptable" monthly churn rate based on your company's stage, target customer, and price point. Find the profile that most closely matches your own to get a realistic target.
| Company Profile | Acceptable Monthly Logo Churn | Acceptable Monthly Revenue Churn | Context/Notes |
|---|---|---|---|
| Early-Stage Startup | 5% - 7% | 4% - 6% | High churn is expected while finding product-market fit. Focus on learning from churned customers. |
| SMB B2B (Low ARPU) | 3% - 5% | 2% - 4% | Customers are more price-sensitive and have lower switching costs. |
| Mid-Market B2B | 1.5% - 3% | 1% - 2% | Products are more integrated into workflows, making them stickier. |
| Enterprise B2B (High ARPU) | 1% - 2% | < 1% | Very sticky due to high switching costs, deep integration, and long-term contracts. |
| High-Volume B2C | 6.5% - 8% | 6% - 7.5% | Driven by low contract values, monthly billing, and high price sensitivity. |
Use these numbers as your guide. They provide the context needed to set goals that make sense for your business, not some generic industry average.
For an even deeper dive, our comprehensive guide on SaaS churn rate benchmarks can help you pinpoint the exact target you should be aiming for. By comparing your numbers to companies that actually look like yours, you can stop chasing an arbitrary number and start building a truly healthy, sustainable business.
Uncovering the Real Reasons Customers Leave
Let's be honest: customers almost never leave a product they genuinely love and depend on. When they hit that "cancel" button, it's not a random act. It’s a symptom of a much deeper issue. Just tracking the average churn for SaaS is a start, but the real magic happens when you figure out why people are walking away.
Thinking of churn as just one big number is a huge mistake. It’s actually a collection of individual stories and pain points. You have to put on your detective hat and look past the cancellation email. Did your marketing make a promise the product couldn't keep? Did a key feature crash right when they needed it most? Or did they just stop seeing the value? Every lost customer leaves behind a trail of clues that can help you fix a fundamental problem in your product, onboarding, or support.
Flawed Onboarding and the Missing "Aha Moment"
The first 30 to 90 days are do-or-die. A confusing, clunky, or overwhelming onboarding process is the fastest way to push a new customer toward the exit. If they can't get a quick, meaningful win—that critical "aha moment"—they'll start wondering why they’re paying you at all.
This isn’t about throwing a kitchen-sink tour of every feature at them. Good onboarding is about guiding them to solve the one specific problem they signed up to fix.
- Red Flag: You see a massive drop-off rate after the first week.
- Red Flag: New users are only touching one or two of the most basic features.
- Red Flag: Your support team is drowning in tickets from new customers asking about basic setup.
When people feel lost or fail to see immediate value, their motivation to learn and integrate your tool disappears. They don't churn because your product is bad; they churn because they never figured out how to make it great for them.
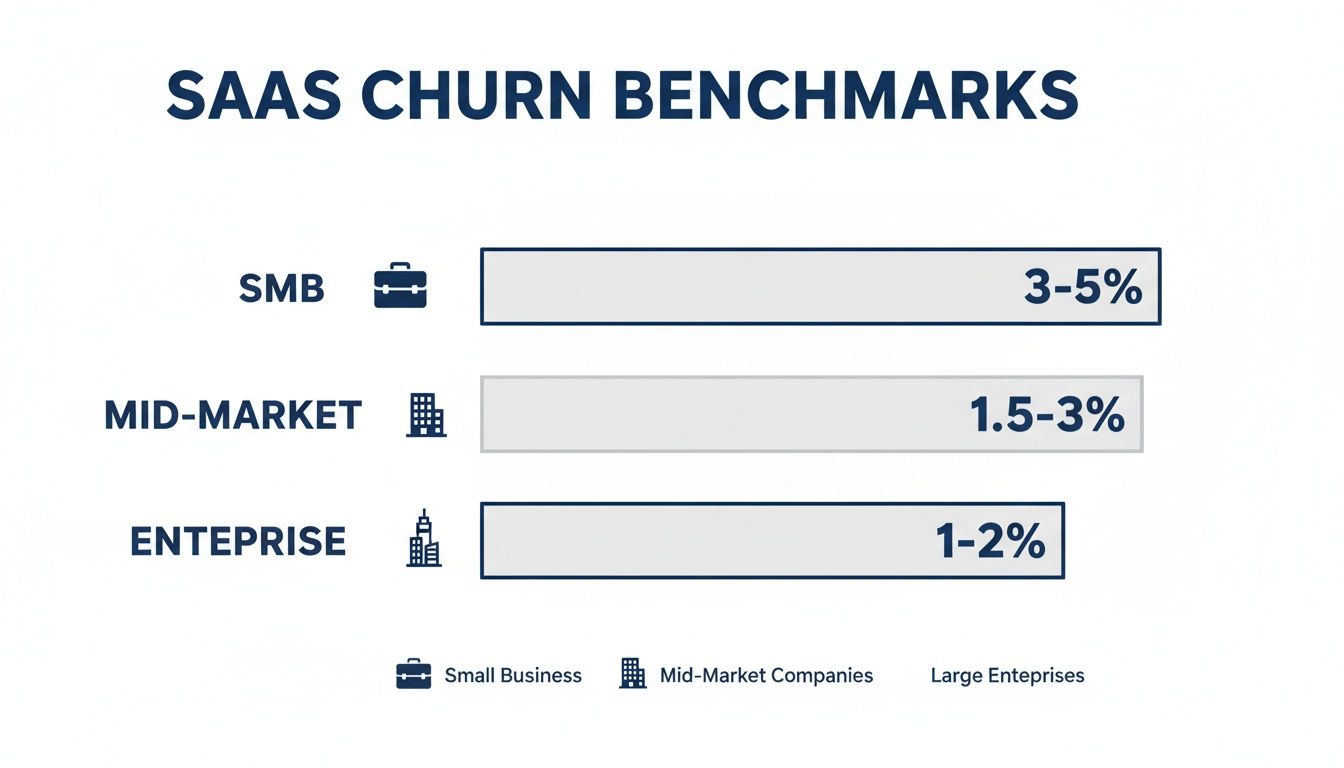
As this data shows, what's considered a "good" churn rate changes dramatically with customer size. A 5% monthly churn rate might be acceptable when serving SMBs, but it would be a disaster for an Enterprise-focused company.
Product Gaps and Poor Quality
Sometimes, the reason for churn is brutally simple: the product just isn't cutting it. This can show up in a few different ways. Maybe it's riddled with bugs, runs slower than molasses, or is missing that one killer feature all your competitors have. When you're digging into why customers churn, product defects are often a major culprit. Getting a handle on this means mastering the software bug life cycle.
A product that constantly breaks erodes trust. Even small, annoying bugs add up, creating friction that wears customers down over time. If they're spending more time reporting issues to you than actually getting their work done, they’re already shopping for a replacement.
Another silent killer is the value gap. This is when the price a customer pays feels completely disconnected from the value they get. If your prices go up but the product doesn't get any better, customers will start scrutinizing their subscription and asking tough questions.
Ineffective Customer Support and Communication
Terrible customer support can turn a small, fixable problem into a lost account. When a customer reaches out for help, they expect a timely, empathetic, and—most importantly—effective answer. Long waits, canned responses, and getting passed around between departments is a recipe for frustration.
But this is about more than just putting out fires. Proactive communication is just as crucial.
- No Proactive Check-ins: You aren't reaching out to make sure customers are succeeding.
- Poor Feature Announcements: You roll out updates without explaining the benefits or showing people how to use them.
- Ignoring Feedback: Customers feel like their bug reports and feature requests vanish into a black hole.
At the end of the day, customers want to feel like you're a partner in their success. When your support feels cold and transactional, that partnership breaks down—and their loyalty goes right along with it.
Proven Strategies to Reduce SaaS Churn
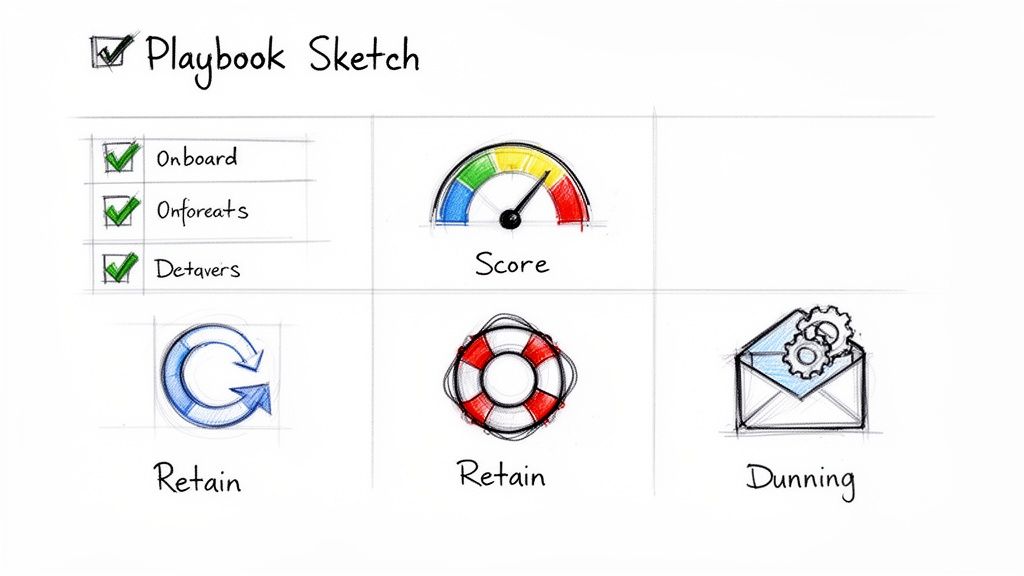
Knowing your churn rate is one thing; actually doing something about it is another. Once you've moved past the dashboards and benchmarks, it's time to roll up your sleeves and build a playbook of strategies that actually keep customers around. This isn't just about saving accounts—it's about making your product and your entire business more resilient.
We'll look at both proactive ways to create happy, successful customers and the reactive moves you need to make when an account is on the ropes. After all, every customer you keep strengthens your bottom line and gives you a priceless look into what makes your product truly valuable.
Nail the Onboarding Experience
Let's be blunt: if you mess up a customer's first 30 to 90 days, you've probably lost them. A clunky, confusing, or overwhelming onboarding experience is the number one killer of new accounts. People sign up to solve a problem, and if they can't get that first quick win—that "aha moment"—they'll start regretting their purchase almost immediately.
Good onboarding isn't a feature tour. It's a guided path to value.
- What to do: Don't treat every user the same. A power user from an enterprise team needs a different onboarding path than a solo founder. Segment your flows based on what they're trying to accomplish.
- What to do: Use in-app checklists or progress bars. These simple tools give users a sense of momentum and pull them toward the actions that will make them stick around.
Set Up a Customer Health Scoring System
Churn rarely comes out of the blue. Long before a customer hits the cancel button, they leave a trail of breadcrumbs: they log in less often, support tickets spike, or their main champion at the company leaves. A customer health scoring system is your radar for spotting these red flags early.
The idea is to combine different data points—like product usage, support interactions, and even billing status—into a single score. Think of it as an early warning system that lets your team step in before it's a full-blown emergency.
When a customer's health score suddenly tanks, it's a signal to act. This is what helps a customer success team shift from constantly fighting fires to proactively reaching out and offering help before the customer even thinks about leaving.
Build Robust Feedback Loops
No one likes feeling ignored. One of the stickiest things you can do is create obvious channels for feedback and then—this is the important part—visibly act on it. When customers see their suggestions come to life in the product, they stop feeling like a line item and start feeling like a partner.
This is more than just a suggestion box. It's about creating a conversation.
- Collect feedback everywhere: Use short in-app surveys, schedule quarterly reviews with your bigger accounts, and always ask for feedback after a support ticket is closed.
- Look for patterns: Dig through the feedback to find the common threads. Multiple people complaining about the same thing isn't a coincidence; it's a priority.
- Close the loop: When you ship a fix or a feature based on feedback, shout it from the rooftops. Announce it in your newsletter and give a public thank you to the customers who asked for it.
Automate Dunning to Stop Involuntary Churn
Not all churn happens on purpose. A surprisingly large slice of the average churn for SaaS is involuntary churn, which is just a fancy way of saying a payment failed. An expired credit card or a temporary lack of funds can cause an accidental cancellation. This is the easiest churn to fix.
A smart dunning process automatically handles these failed payments. It sends polite reminders, makes it dead simple for customers to update their card info, and recovers revenue you would have otherwise lost. It's a quick win. And while we're on the topic of smart automation, implementing referral program best practices can also help by bringing in stickier customers who are referred by your best users.
Learn From Every Customer You Lose
Look, some churn is just going to happen. But a customer walking out the door is an unfiltered learning opportunity. Sending an exit survey is your last, best chance to get brutally honest feedback on what went wrong.
Keep it short and sweet. Ask them why they're leaving, which competitor they chose (if any), and what one thing could have made them stay. The answers are pure gold. They'll expose the product gaps, pricing problems, or service failures you need to fix to keep the next customer from leaving for the same reason. For a deeper dive, you can explore a full playbook of tactics in our guide on how to reduce customer churn.
Common Questions About SaaS Churn
Even after you've got the basics down, a few common questions always seem to surface when talking about churn. Let's tackle them head-on, so you can move forward with a clearer picture of what matters.
Can You Actually Get to a 0% Churn Rate?
The short answer? Not really. While a 0% churn rate sounds like the holy grail, it’s not a realistic target for most businesses. The truth is, some churn is just a natural part of doing business. Companies go out of business, budgets get slashed, or your champion at a key account leaves for another job. These things are completely out of your control.
Instead of chasing zero, the real goal is to achieve negative net revenue churn. This is the magic number. It means the new revenue you're generating from your existing customers—through upgrades, cross-sells, or seat expansions—is greater than the revenue you're losing from the customers who leave. When you hit this, your business is growing on autopilot from its current customer base, even before you land a single new logo. That's a sign of an incredibly healthy, sticky product.
How Often Should We Be Calculating Churn?
For nearly every SaaS company, tracking churn on a monthly basis is the sweet spot. It's frequent enough to give you actionable feedback without making you dizzy from the noise of daily fluctuations.
- Weekly checks? Too noisy. You'll drive yourself crazy reacting to tiny blips that don't mean anything in the grand scheme of things.
- Quarterly or annually? Way too slow. By the time you spot a problem, the damage is already done, and you've missed your window to fix it.
A monthly cadence lets you see real trends emerge, test your retention strategies, and make smart adjustments on the fly. It keeps churn a priority without creating analysis paralysis, which is why it's the standard for understanding the average churn for SaaS businesses.
What’s the Difference Between Voluntary and Involuntary Churn?
To really understand why customers leave, you have to split churn into two main buckets. They have completely different causes and require totally different solutions.
Voluntary Churn: This is when a customer makes a conscious decision to hit the "cancel" button. They might be unhappy with the product, found a competitor they like better, or their needs have simply changed. This is the churn you fight head-on with a great product, responsive support, and a proactive customer success team.
Involuntary Churn: This is the silent killer. It happens when a customer leaves accidentally, almost always because of a failed payment. Think expired credit cards, maxed-out limits, or other generic bank declines. The customer didn't mean to leave, but they did. The good news is this churn is almost entirely preventable with smart dunning and payment recovery tools.
Ready to stop guessing and start predicting churn? LowChurn uses AI to identify at-risk customers 7-30 days before they cancel, giving you the time and tools to save them. Connect Stripe in one click and see your retention improve in weeks. Learn more about how LowChurn works.