Calculating your retention ratio is, at its core, pretty simple. You're just looking at how many customers you held onto over a specific period compared to how many you started with. But don't let that simplicity fool you—this one metric tells you nearly everything you need to know about the long-term health of your SaaS business. Getting this calculation right isn't just a good idea; it's essential for building something that lasts.
Why Retention Is Your Most Important SaaS Growth Lever
Before we get into the nuts and bolts of the formulas, we need to talk about why this metric demands so much attention. In the SaaS world, everyone loves to talk about customer acquisition. It's exciting. But retention is the quiet, powerful engine that actually drives growth. It's what separates a business that scales smoothly from one that's constantly on a hamster wheel, desperately signing up new users just to replace the ones who are leaving.
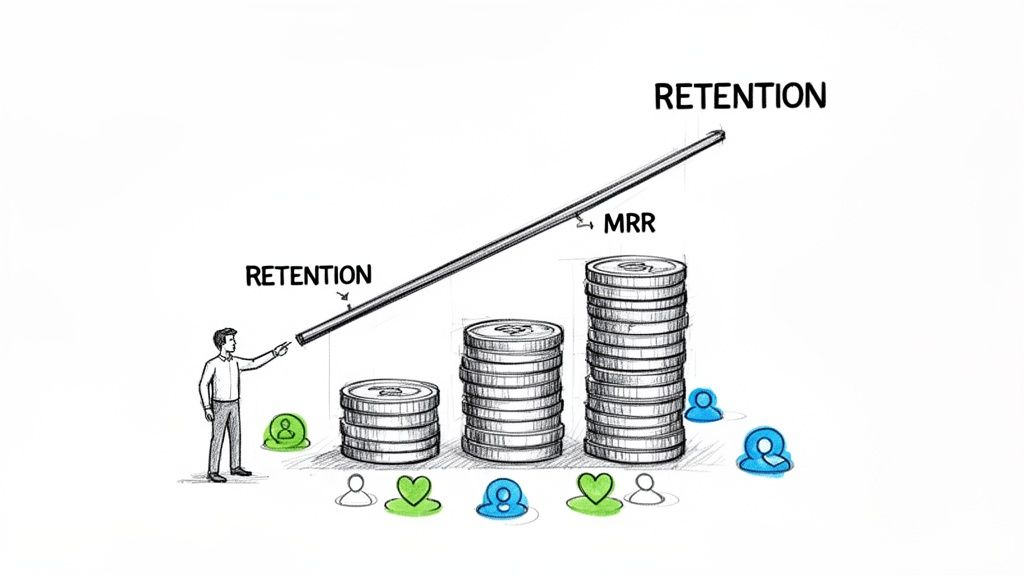
I like to think of a customer base as a bucket you’re trying to fill with revenue. Your marketing and sales efforts are the hose, pouring water in. But if that bucket is full of holes—what we call churn—you'll never fill it up, no matter how hard you try. Calculating your retention ratio is how you find and measure those holes.
The Compounding Power of Small Gains
Even a tiny improvement in your retention rate can have an outsized impact on your bottom line. You've probably heard the famous study from Bain & Company: increasing customer retention by just 5% can lead to a profit increase of 25% to 95%. That's not a one-off bump. It's a compounding force that builds on itself month after month.
Here's a breakdown of how solid retention becomes your growth flywheel:
- Boosts Customer Lifetime Value (LTV): This one's straightforward. The longer a customer sticks around, the more they pay you. This drastically improves the return on what you spent to acquire them in the first place.
- Builds a Predictable Revenue Engine: High retention means stable Monthly Recurring Revenue (MRR). That predictability is a dream for founders and exactly what investors look for. It's proof of a sticky product and real product-market fit.
- Lowers Acquisition Costs: Your happiest, most loyal customers become your most effective marketers. They leave glowing reviews, refer new customers, and build your reputation through word-of-mouth, creating a powerful growth loop that costs you next to nothing.
For a SaaS startup, a leaky bucket isn’t just an inconvenience—it’s an existential threat. A small, unaddressed churn problem can quietly drain your MRR, making growth impossible no matter how many new customers you acquire.
When it comes down to it, calculating retention isn't just a task you hand off to the finance team. It's a strategic pulse-check on your company. It gives you a clear signal on your product's value, the health of your customer relationships, and the viability of your entire business model. It answers the most important question: are you building a sustainable company or just running in place?
Calculating Your Customer Retention Rate
Let's start with the most fundamental retention metric out there: Customer Retention Rate (CRR). This number answers a simple but critical question: how good are you at keeping the customers you already have? Think of it as your bedrock metric for measuring customer loyalty and product stickiness.
The calculation itself is pretty straightforward. The key is to focus on a specific group of customers over a set period—like a month or a quarter—while intentionally ignoring any new customers you signed up during that time.
CRR Formula = [ ( Customers at End of Period - New Customers ) / Customers at Start of Period ] x 100
What you're left with is a clean percentage showing how many of your original customers stuck around. A high CRR is a fantastic sign that you've built something valuable that people don't want to leave.
Putting the Formula Into Practice
So, how does this look in the real world? Let’s imagine you run a B2B SaaS company and you're calculating your CRR for the month of April using your Stripe data.
- Customers at Start (S): You check your records on April 1st and see you have 500 active, paying customers.
- Customers at End (E): Fast forward to April 30th, and your active customer count has grown to 540.
- New Customers Acquired (N): Over the course of the month, your sales and marketing efforts brought in 60 brand new customers.
Now, we just plug those numbers into the formula:
[ ( 540 - 60 ) / 500 ] x 100
[ 480 / 500 ] x 100 = 96%
Your Customer Retention Rate for April is a solid 96%. This tells you that you successfully held onto 96% of the customers you started the month with—a very strong signal of a healthy business. If you want to dig even deeper, there's a great guide on mastering customer retention rate calculation that breaks it down further.
Here’s a simple table to visualize that calculation step-by-step.
Customer Retention Rate (CRR) Calculation Example
| Metric | Value | Description |
|---|---|---|
| Customers at Start | 500 | The number of paying customers on April 1st. |
| Customers at End | 540 | The total number of paying customers on April 30th. |
| New Customers Acquired | 60 | The number of new customers added during April. |
| Retained Customers | 480 | Calculated as (540 - 60). |
| Customer Retention Rate | 96% | Calculated as (480 / 500) x 100. |
As you can see, the process isolates the original customer base to give you a true measure of loyalty, separate from new customer acquisition.
Common Pitfalls To Avoid
Calculating your retention rate seems simple on the surface, but I’ve seen plenty of founders trip over a few common details. Watch out for these mistakes that can easily throw off your numbers:
- Mixed Billing Cycles: If you serve customers on both monthly and annual plans, calculating a true monthly CRR can get messy. To get a cleaner signal, it’s often better to look at retention on a quarterly or even annual basis to smooth out the differences.
- Defining "Active": You need to be consistent. Does "active" just mean a user who logged in, or does it specifically mean a paying subscriber? For any SaaS business, you should almost always anchor this definition to paying customers.
- Handling Reactivations: What about a customer who churned last month but came back in April? They aren't a "New Customer" (N). If they were part of your starting group, they should simply be part of your "Customers at End" (E) total, reflecting that they were successfully retained (or won back).
Getting these details right is the difference between a vanity metric and a truly useful KPI. For a more advanced look at tracking specific customer groups, our guide on what is cohort analysis is a great next step.
In the fast-paced SaaS world, the average customer retention rate is around 68%, but for smaller businesses with under $300k in ARR, it can drop to just 55%. This paints a clear picture: for early-stage startups, survival absolutely depends on nailing retention. The top performers hitting 85% CRR or higher aren't just getting by—they're building the predictable, compounding revenue that fuels real, sustainable growth.
Moving Beyond Headcount To Revenue Retention
Knowing your Customer Retention Rate (CRR) tells you if your customer base is sticking around, but it doesn't give you the full picture of your financial health. A SaaS business can actually lose a few customers but still grow its revenue if the ones who stay start spending more. This is exactly why you need to get a handle on revenue retention.
It really comes down to two key metrics: Gross Revenue Retention (GRR) and Net Revenue Retention (NRR). Each gives you a different, yet equally important, view of your business's stability and potential for growth. If you're serious about your SaaS, you need to understand both.
Before we dive into the revenue side, let's remember the basic process of just tracking customers. It's the foundation for everything else.
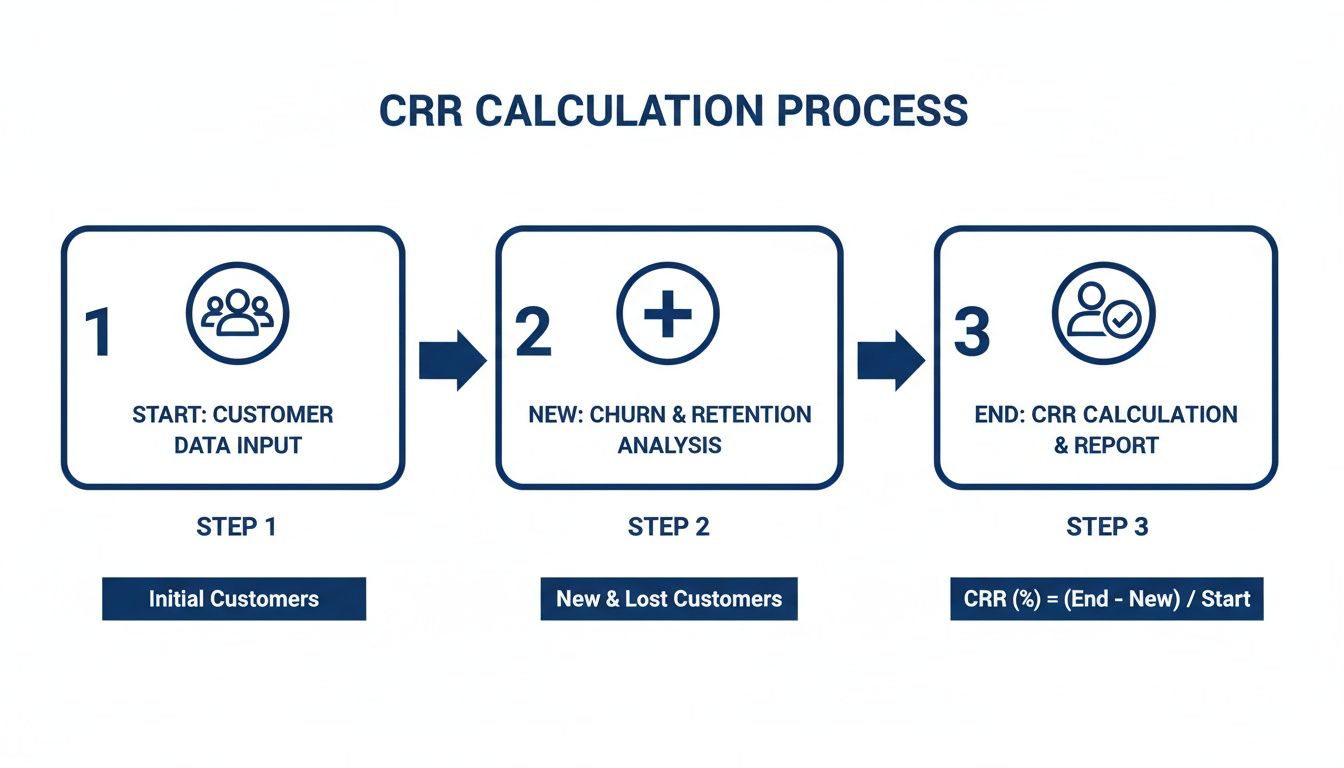
This flow—tracking who you start with, who you gain, and who you end with—sets the stage perfectly for the more detailed financial analysis involved in GRR and NRR.
Unpacking Gross Revenue Retention
Gross Revenue Retention (GRR) gives you the purest, most honest look at how well you're holding onto revenue from your existing customers. It intentionally ignores any new money from upsells or expansion. Instead, it just measures how much of your starting Monthly Recurring Revenue (MRR) you kept after accounting for cancellations (churn) and downgrades (contractions).
Here’s the formula:
GRR = [ ( Starting MRR - Churned MRR - Contraction MRR ) / Starting MRR ] x 100
Think of GRR as your revenue defense score. A high GRR, ideally 90% or more, proves your core revenue is solid and isn't slowly leaking away. It’s a fantastic indicator of product stickiness and shows customers are happy with what they're currently paying for.
For B2B SaaS retention teams, the benchmarks tell a clear story. Medians hover around 90-92%, which means an 8-10% annual revenue churn that can seriously erode your MRR if you don't stay on top of it.
Let's walk through a quick example. Say your SaaS started the month with $50,000 in MRR.
- You lost $3,000 in MRR from customers who canceled their subscriptions (Churned MRR).
- You lost another $1,500 from customers who downgraded to cheaper plans (Contraction MRR).
Here’s how the math plays out:
[ ( $50,000 - $3,000 - $1,500 ) / $50,000 ] x 100 = 91%
Your GRR is 91%. That's a strong, healthy number that shows you’re doing a great job at keeping the revenue you already have.
Introducing Net Revenue Retention
While GRR is all about defense, Net Revenue Retention (NRR) is your offense. This is the metric that gets investors really excited because it proves you can grow from within your existing customer base. NRR takes the GRR formula and adds back any expansion revenue from upsells, cross-sells, or new add-ons.
The formula simply builds on GRR:
NRR = [ ( Starting MRR - Churned MRR - Contraction MRR + Expansion MRR ) / Starting MRR ] x 100
An NRR over 100% is the holy grail for a healthy SaaS business. It means you're making more money from your current customers than you're losing from those who churn or downgrade. This creates "negative churn," a magical state where your company grows even if you don't sign up a single new customer. If you want to dive deeper, we have a whole guide covering the essentials of Net Retention Rate.
Let’s use the same numbers as before, but this time, let’s factor in some growth.
- Starting MRR: $50,000
- Churned MRR: $3,000
- Contraction MRR: $1,500
- Expansion MRR: $7,000 (from customers upgrading plans or adding new features)
Plug those numbers into the NRR formula:
[ ( $50,000 - $3,000 - $1,500 + $7,000 ) / $50,000 ] x 100 = 105%
Your NRR is 105%. This is a massive win. It sends a powerful signal that your product delivers more and more value over time, and your customers are willing to pay for it.
Turning Retention Data Into Growth Strategies
Figuring out your retention ratio is a solid first step, but let's be honest—the numbers themselves don't do anything. The real magic happens when you translate those percentages into a concrete plan for your product and customer success teams. This is the moment you shift from simply taking your business's temperature to actively making it healthier.
A great place to kick things off is by seeing how you stack up. How does your 96% CRR compare to others in your niche? Knowing whether you're leading the pack or just keeping pace gives you critical context and helps you set goals that are ambitious but achievable.
From Numbers to Narratives
The most effective way I've seen to understand retention is through cohort analysis. This just means grouping customers by the month they signed up and watching how that group behaves over time. It lets you see the story behind the data.
For instance, your cohort analysis might show that customers who joined in March are churning way faster than your February sign-ups. That’s a huge red flag and immediately prompts some critical questions:
- Did a new feature we shipped in March have a nasty bug?
- Did we tweak the onboarding flow that month?
- Was there a big competitor campaign that lured our newest users away?
By isolating these cohorts, you can stop guessing and start pinpointing the real reasons for churn. You might find that users who don't engage with a certain "sticky" feature in their first 30 days are almost guaranteed to cancel. That's a direct signal to your team: get that feature front-and-center during onboarding, ASAP.
A retention rate tells you what happened in the past. A cohort analysis is your diagnostic tool—it shows you exactly where to focus your energy to create a better future.
Linking Retention Insights to Actionable Strategies
Once you’ve uncovered the "why," you can start building smart, targeted strategies to address it. Calculating the numbers is one thing, but implementing 10 actionable SaaS customer retention strategies is what actually drives long-term growth.
Take Net Revenue Retention (NRR), for example. It’s an incredibly powerful metric because it measures growth coming from the customers you already have. The data doesn't lie: companies with NRR over 100% grow at an impressive 43.6% each year. Meanwhile, those struggling below 60% barely grow at all.
The gap is especially clear when you segment the market. A mere 2.7% of low-priced B2C SaaS companies manage to break 100% NRR. Contrast that with high-ticket B2B platforms, where 41.1% hit that mark.
This kind of data gives you a clear strategic path. If your NRR is languishing below 100%, your top priority is plugging leaks—reducing churn and revenue contraction. But if you’re already over 100%, your biggest growth lever might be creating a new add-on or a higher-tier plan to drive more expansion revenue. This is how raw data gets turned into a winning playbook for your entire company.
How To Automate Your Retention Tracking
Let's be honest, manually exporting data to calculate retention in a spreadsheet is a rite of passage for almost every SaaS founder. It works when you're just starting out, but it quickly becomes a time-consuming chore that’s dangerously prone to human error. I've seen it happen: one misplaced formula can give you a false sense of security or send your team into an unnecessary panic.
The good news? You can—and should—move beyond the spreadsheet grind. The modern way to handle retention is by connecting your payment processor directly to a specialized analytics tool. This is where automation becomes your best friend in the fight against churn.
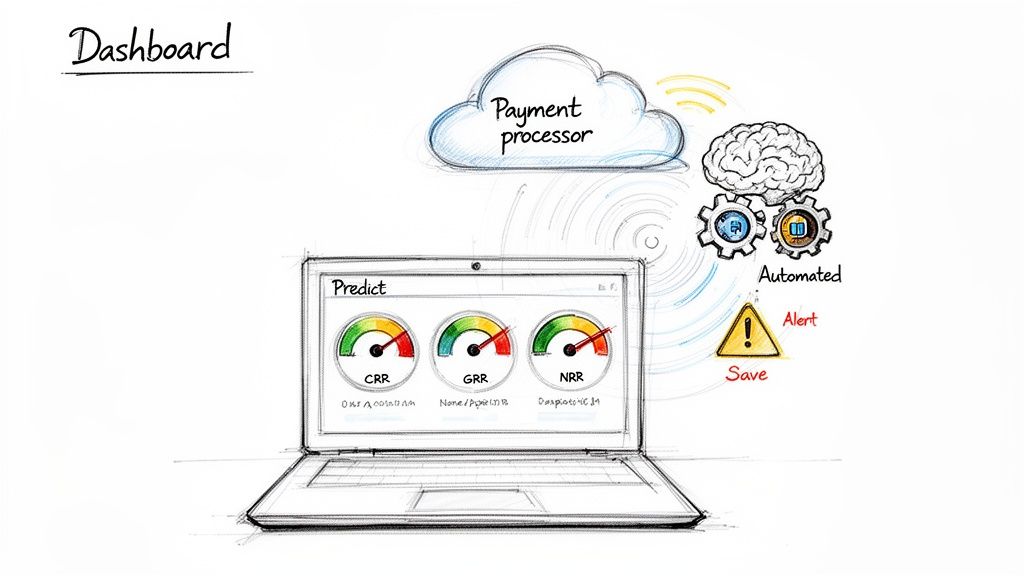
A dashboard like this gives you a real-time, predictive view of customer health, going way beyond basic calculations. It's not just about what happened last month; it's about spotting future risks so you can act before customers decide to leave.
Connecting Your Data for Instant Insights
If you’re running your SaaS on Stripe, the setup is incredibly straightforward. Platforms like LowChurn are built for this, often integrating with just a single click. By granting read-only access to your Stripe account, these tools pull all your subscription data automatically.
Suddenly, you have real-time dashboards for all the crucial metrics:
- Customer Retention Rate (CRR): Instantly see the percentage of customers sticking with you month after month.
- Gross Revenue Retention (GRR): Get a clean look at your revenue stability, before factoring in expansion.
- Net Revenue Retention (NRR): Understand your true growth engine by including upsells and cross-sells.
Instead of burning hours every month wrestling with CSV files, your metrics are always current and ready to go. This frees up your team to focus on what the data means, not just on gathering it.
From Reactive Calculations to Proactive Prevention
The real magic of these automated platforms isn't just about doing math faster. It's about shifting your entire retention strategy from reactive to proactive. By analyzing payment signals and customer behavior, AI-powered tools can flag churn risks long before a customer even thinks about hitting the "cancel" button.
The goal isn't just to report on last month's churn; it's to prevent next month's. Automation gives you the early warning system needed to turn data into saved revenue.
This is where you gain a massive advantage. The system can generate dynamic customer health scores, highlighting accounts that show signs of disengagement or are having payment trouble. Your customer success team can then jump in at the perfect moment with targeted help. To really dig into how this works, check out the fundamentals of using predictive analytics for customer retention.
Ultimately, automation turns retention tracking from a backward-looking accounting task into a forward-looking growth strategy. It gives you the insights to not only see why customers churned but to actively persuade current ones to stay, directly protecting your bottom line.
Sticking Points: Common Questions When Calculating Retention
Once you have the formulas, you’d think calculating retention would be straightforward. But as anyone who's actually done it knows, the real world is messy. Questions pop up fast.
The biggest one I see is how to handle different billing cycles. What do you do when you have a mix of monthly and annual subscribers? Trying to jam them all into a single monthly retention rate is a classic mistake.
An annual subscriber who signed up in January can't churn until next January. Their presence in your monthly calculation makes your retention look better than it really is. To get a more honest signal, it’s usually better to look at retention on a quarterly or even annual basis. This smooths out the noise from different contract lengths.
Another point of confusion is the difference between customer churn and revenue churn. They tell you very different stories, and you absolutely need both.
Customer churn is about the number of logos you lose. Revenue churn is about the dollars you lose. It's entirely possible to have a low customer churn rate but a terrifyingly high revenue churn rate if the few customers walking out the door are your biggest accounts.
Finding Your Reporting Rhythm
So, how often should you be poring over these numbers? It really depends on your business stage, but the most important thing is to be consistent.
Here’s a practical breakdown I recommend:
- Monthly: This is your pulse check. It's perfect for seeing the immediate impact of tactical changes. For instance, did that new onboarding sequence you launched last month actually reduce first-month churn? Monthly tracking gives you that quick feedback loop.
- Quarterly: This is for strategy. A quarterly view helps you ignore the random monthly blips and spot the meaningful trends. Are specific customer segments starting to churn more? This is the cadence where those patterns become clear.
- Annually: This is your long-term health report card. It’s what you use for high-level planning and what your investors will care about. It shows the fundamental stickiness of your product over time.
For most SaaS companies, a monthly check-in combined with a deeper strategic review each quarter is the sweet spot. It keeps you agile enough to fix problems without getting whiplash from every little dip.
Tired of wrestling with spreadsheets for these numbers? LowChurn can turn your Stripe data into a predictive churn dashboard, flagging at-risk customers before they leave. It uses AI to spot patterns you can't, helping you save revenue proactively. See your dashboard in under 60 seconds.