Predictive analytics is all about using your existing data—from customer behavior to subscription history—to spot which customers are likely to leave. It's the difference between firefighting to save an account that's already halfway out the door and stepping in proactively with the right support at the right time.
This approach transforms your retention strategy from a reactive, gut-feel system into a data-driven machine that protects your revenue and builds real, long-term customer loyalty.
Why Predictive Analytics Is Key to Customer Retention
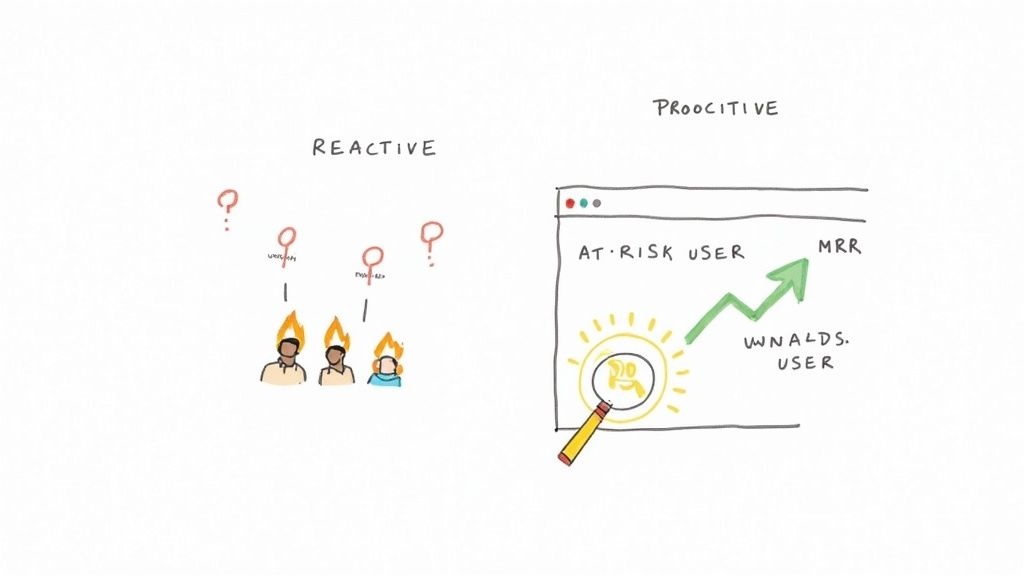
Most SaaS companies are stuck in a reactive loop. A customer sends an angry email, their credit card fails, or they formally request to cancel. Only then does the team scramble to save them. The problem? By that point, it’s usually too late. The customer has already decided to leave, and any last-minute offer can feel desperate.
Predictive analytics completely flips this script. Instead of waiting for obvious red flags, it digs into the subtle, almost invisible patterns in customer behavior to see what’s coming next. It’s not just about flagging who might churn, but getting a much clearer picture of why they're at risk, often weeks or months before they even think about canceling.
Moving from Guesswork to Data-Driven Decisions
Without a solid predictive model, retention efforts are often based on a hunch. A customer success manager might feel like a big account is pulling away, but they don't have hard data to back it up and justify spending extra resources on them.
This is where a predictive model changes the game. It provides concrete evidence by assigning a churn risk score to every single customer based on thousands of data points.
This shift allows your team to stop treating every customer the same and start focusing their energy where it will make the biggest difference. You can prioritize high-value accounts that are showing early signs of risk. Suddenly, retention isn't just an art form; it becomes a science with measurable, repeatable results.
The real power of predictive analytics lies in its ability to unmask the "silent churners." These are the customers whose engagement slowly fades until one day, they just disappear. This acts as a crucial early-warning system for your revenue.
The Tangible Impact on Your Business
Getting ahead of churn has a massive, direct impact on your bottom line. It's not just about clawing back a few lost accounts; it's about fundamentally strengthening customer relationships and boosting their lifetime value. In fact, proactive outreach powered by predictive insights can cut churn rates by as much as 30% and increase customer satisfaction by 25%. Find out how AI is transforming customer retention.
The benefits go far beyond just plugging a leaky bucket:
- Improved MRR Stability: When you save at-risk accounts before they leave, you protect your Monthly Recurring Revenue from those painful, unexpected nosedives.
- Enhanced Customer Experience: Stepping in with the right help at the right moment shows customers you're paying attention and value their business, which builds incredible loyalty.
- Increased Efficiency: Your customer success and support teams can stop guessing who needs help and start running targeted, high-impact retention campaigns.
Ultimately, predictive analytics gives you the foresight to stop churn before it even starts, helping you build a much more sustainable and profitable business.
Building Your Data Foundation for Prediction
Let's be clear: predictive models aren't magic. They're powerful engines that run on data, and the quality of your fuel determines how far you'll go. If you feed a model weak, incomplete information, you'll get unreliable guesses in return. It's that simple.
To build a truly effective system for predictive analytics for customer retention, you have to pull together different data sources to create a single, unified picture of each customer's journey. This means going way beyond basic subscription details and learning to read the subtle signals hidden in their everyday interactions with your business.
Essential Data Sources for Churn Prediction
The most accurate predictions don't come from a single source; they come from weaving together different types of data, each telling a piece of the customer's story. Think of yourself as a detective assembling clues. The table below breaks down the must-have data categories.
| Data Category | Specific Data Points | Why It Matters for Prediction |
|---|---|---|
| Subscription & Billing | Payment failures, dunning status, plan upgrades/downgrades, trial-to-paid conversions, coupon usage, subscription pauses. | This is the financial pulse of the customer relationship. A failed payment or a sudden downgrade is a direct and powerful signal of potential churn. |
| Product Usage | Login frequency, session duration, key feature adoption rate, number of active users (for team accounts), invites sent. | This tells you if they're getting value. A sharp drop in logins or the neglect of core features is a massive red flag that the product is no longer essential. |
| Customer Interactions | Support ticket volume, ticket resolution time, NPS/CSAT scores, live chat sentiment, responses to marketing emails. | This is the voice of the customer. A once-active user who suddenly goes silent is often a bigger risk than one who is actively (and loudly) seeking help. |
Looking at this, it's clear why relying on just one stream of data is a common but costly mistake. The real predictive power emerges when you connect the dots between them.
A user with declining product engagement and a recent failed payment is a much higher-priority risk than a user showing just one of those signals. The combination is what turns a weak signal into a clear warning.
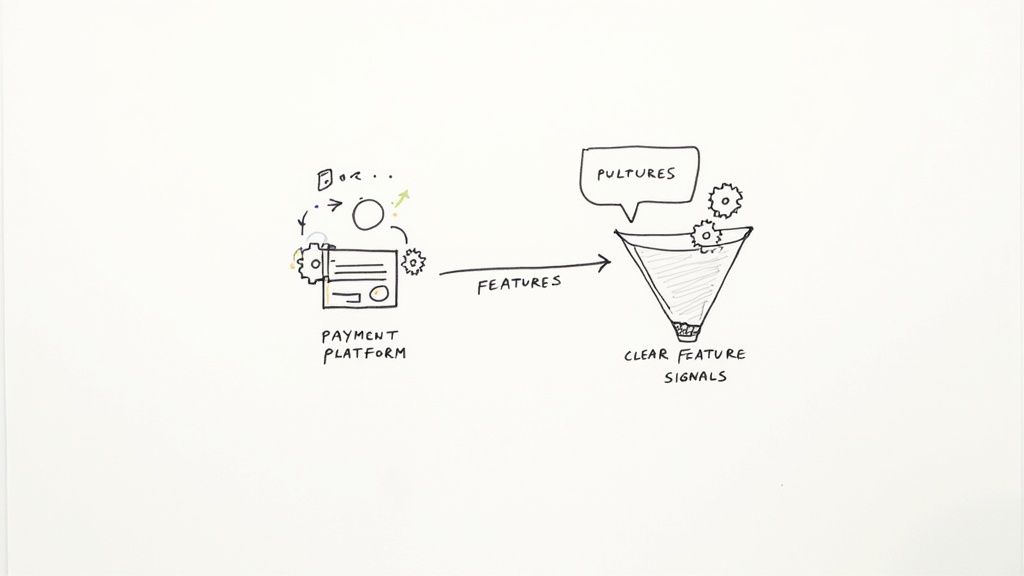
The Art of Feature Engineering
Raw data, on its own, is pretty useless to a machine learning model. You can't just dump a list of login timestamps into an algorithm and expect a brilliant prediction. This is where feature engineering comes in—it's the process of transforming raw data into meaningful inputs, or "features," that a model can actually understand.
This is less of a science and more of an art. You're essentially translating raw events into context-rich signals. For example, instead of just using raw data points, you'd calculate things like:
- Time Since Last Login: How many days has it been since the user was active?
- Feature Adoption Rate: What percentage of your "sticky" features has this customer actually used?
- Support Ticket Ratio: How many support tickets has a user filed per month of their subscription?
By creating these engineered features, you're giving the model the context it needs to spot patterns. A single short session isn't very telling, but a steady decline in session duration over the past 30 days is an incredibly powerful predictor.
Ultimately, this whole process starts with a solid baseline. Understanding your metrics is just as critical as the final prediction, which is why a firm grasp of how to approach a proper churn rate calculation is so fundamental. It defines the very thing your model is trying to predict.
Picking the Right Predictive Model (and Making Sure It Works)
Alright, your data is prepped and ready to go. Now comes the part that can feel a bit intimidating: choosing the right machine learning model. Don't worry, you don't need a data science Ph.D. for this. The real goal is to find a model that fits your data, your team's comfort level, and what you need it to do for your business.
There's a whole world of machine learning models out there, but for predicting churn, a few usual suspects consistently get the job done. Let's walk through the most common choices, ditching the jargon to focus on what they're good at and where they might fall short.
The Go-To Models for Churn Prediction
There's no single "best" model for everyone. It's always a balancing act between simplicity, raw predictive power, and how easily you can explain why it's making certain predictions.
Logistic Regression: This is almost always the best place to start. It’s fast, straightforward, and you can easily see what’s driving the predictions. The model basically tells you the probability of a customer churning and clearly shows you which factors (like "days since last login") are pushing that risk score up or down. It’s the workhorse of predictive modeling.
Random Forest: Think of this as a committee of experts. Instead of one model, it builds hundreds of individual "decision trees" and then takes a majority vote on whether a customer is likely to churn. This approach makes it much more powerful and accurate than a single Logistic Regression model, and it's great at finding complex patterns in your data without needing a ton of manual tuning.
Gradient Boosting Machines (like XGBoost): These are the heavy hitters. A Gradient Boosting model builds a series of models one after the other, where each new one learns from the mistakes of the previous one. This method often squeezes out the absolute best accuracy, but it’s more complex to set up and the "why" behind its predictions can be a bit of a black box. This is your go-to when every last percentage point of accuracy matters.
For most teams just getting started, you really can't go wrong with either Logistic Regression or a Random Forest. They hit that sweet spot between solid performance and practical usability.
How Do You Know If Your Model Is Any Good?
Building a model is just the first step. You have to be able to trust what it's telling you. This is where model validation comes in—you need to test it with a few key metrics to make sure it's not just making lucky guesses.
The most dangerous thing isn't a model that's just plain wrong. It's a model that looks right on the surface but is silently leading you astray. If your model flags hundreds of perfectly happy customers as "high risk," all you've done is create a ton of noise and busy work for your team.
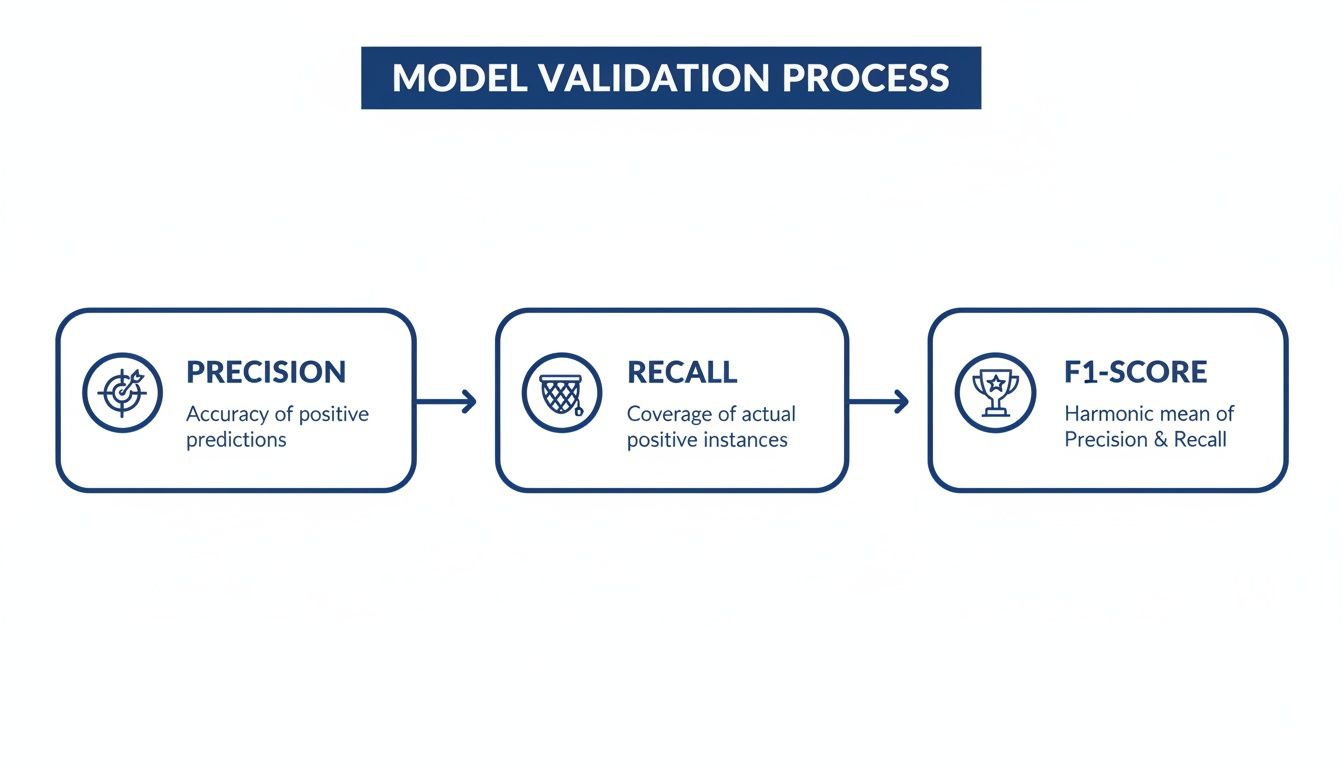
To make sure your model is genuinely useful, you need to measure its performance. Here are the core metrics to focus on:
- Precision: Out of all the customers your model said were "at risk," how many actually would have churned? High precision means your team isn't chasing down false alarms.
- Recall: Out of all the customers who actually did churn, how many did your model successfully flag ahead of time? High recall means you aren't letting at-risk customers slip through the cracks.
- F1-Score: This is simply the balance between Precision and Recall, rolled into a single number. It’s a great way to get a quick, holistic look at how effective the model is overall.
You'll rarely get a perfect score on all of these. The trick is to decide which mistake is more costly for your business. Is it worse to miss a customer who churns (in which case, you'd want to maximize Recall), or is it worse to bother a happy customer with a retention offer (then you'd prioritize Precision)?
Getting this right has a massive impact. For example, one global payments processor that fine-tuned its model saw a 210% improvement in targeting high-risk customers, leading to a 59% drop in churn intention. As a McKinsey article on AI in customer experience points out, a well-validated model isn't just a technical achievement; it's a huge business win.
Turning Predictions into Proactive Retention Plays
A predictive model that just sits on a dashboard is an interesting academic exercise, but it doesn't save a single customer. The real value of predictive analytics for customer retention is unlocked only when you turn its outputs—like churn risk scores—into specific, automated, and timely actions. This is the critical step where your strategy shifts from passive observation to proactive intervention.
The goal is to build a system where a prediction automatically triggers the right response. This means integrating your model's outputs directly into the tools your team already uses, whether it's Salesforce, HubSpot, or a dedicated customer success platform. An elevated churn score shouldn't just be another number on a chart; it should be an active alert that kicks off a predefined retention playbook.
Segmenting At-Risk Customers for Targeted Outreach
Not all at-risk customers are the same, and a one-size-fits-all approach to retention is just plain inefficient. A customer who just signed up and is struggling with onboarding needs a completely different kind of help than a long-time power user whose engagement has slowly faded. The first step in putting your predictions to work is segmenting at-risk users into clear, manageable tiers.
Here's a simple, effective way to think about it:
- High-Risk (Churn Score: 75%+): These customers are on the verge of leaving. Intervention has to be immediate and personal.
- Medium-Risk (Churn Score: 50-74%): These folks are showing clear warning signs but are definitely salvageable with the right attention.
- Low-Risk (Churn Score: 25-49%): Here you're seeing early, subtle signs of disengagement. Light-touch, automated nudges can often get them back on track without heavy lifting from your team.
This tiered approach helps you point your most valuable resource—your team's time—at the accounts where it will make the biggest difference.
Building Your Retention Playbooks
Once you have your risk tiers defined, you can build specific playbooks for each. Think of these as pre-planned sequences of actions designed to address the likely reasons behind their churn risk.
For High-Risk Customers: The name of the game here is direct, high-touch intervention.
- Automated Alert: A high score should instantly create a high-priority task in your CRM for the assigned Customer Success Manager (CSM). No delays.
- Personal Email: The CSM needs to send a personalized email, not from a generic "support@" address, asking for feedback and offering to jump on a call.
- Proactive Offer: For a high-value account, empower the CSM to offer a temporary discount, a free training session, or a one-on-one consultation to resolve their specific pain points.
For Medium-Risk Customers: This is all about re-establishing value and strengthening that personal connection.
- CSM Check-In: The account gets flagged for the CSM to conduct a "health check" call sometime in the next week.
- Value-Reinforcement Email: Enroll the customer in a short, automated email sequence that highlights underutilized features relevant to their specific usage patterns.
- Feedback Survey: Send a targeted in-app survey asking about their experience with a specific part of the product they've been using less.
The whole point of model validation is to make sure you can trust these risk segments. Metrics like Precision and Recall, as shown below, help you fine-tune the model so your team isn't chasing ghosts.
This process ensures your retention efforts are both precise (targeting the right users) and comprehensive (catching as many at-risk customers as you can).
A great retention play is always context-aware. It connects the "who" (the at-risk customer) with the "why" (the data signals that triggered the alert). If a user's score spiked because they stopped using a key feature, the outreach should focus on retraining them on that feature's value.
Finally, remember that these risk scores are a powerful data point to enrich other metrics. They work brilliantly when combined with other signals. To see how, check out our guide on creating a comprehensive customer health score. This helps you build a more complete, nuanced picture of the customer relationship, making every piece of outreach that much more effective.
Measuring the Real-World ROI of Your Retention Efforts
Putting a predictive retention program in place is a huge milestone. But let's be honest, the first question from your leadership team will be, "So, is it actually working?" To answer that, you have to move past feel-good stories and connect your retention activities directly to dollars and cents.
This isn't about guesswork. It’s about building a disciplined way to measure what matters so you can confidently report how many customers you saved and how much revenue you protected. Without that proof, your retention program is just another line item in the budget, not the revenue engine it’s meant to be.
The Metrics That Actually Matter
To prove the financial impact of using predictive analytics for customer retention, you need to speak the language of the C-suite. That means focusing on metrics that tie directly to revenue and growth, not just vanity engagement stats.
- Saved MRR: This is your north star. It’s the total Monthly Recurring Revenue from at-risk customers who you targeted with an intervention and who, crucially, did not churn.
- Churn Rate Reduction: Keep a close eye on your overall churn rate before and after rolling out your program. A steady, sustained decrease is undeniable proof that what you're doing is effective.
- Customer Lifetime Value (CLV) Uplift: When you save a customer, you're not just saving one month's payment—you're preserving their entire future with your company. Showing an increase in average CLV highlights the massive long-term value you’re creating. Need a refresher? You can explore the fundamentals of CLTV in our detailed guide.
Proving Your Impact with A/B Testing
So, how do you know your special offer caused a customer to stay, instead of them just deciding to stick around on their own? The answer is a good old-fashioned A/B test. For isolating the true impact of your work, this is the gold standard.
The setup is pretty simple. Once your model flags a group of at-risk customers, you split them in two:
- Test Group: These folks get the intervention you’ve planned—maybe it's a personal call from their account manager, a discount offer, or a targeted re-engagement email.
- Control Group: This group gets nothing. You just let them be and observe what happens.
After a subscription cycle or two, you compare the churn rates between the groups. The difference in retained revenue is the direct, measurable lift from your efforts.
For example, let's say the control group churned at 15%, but the test group that received your outreach only churned at 5%. You can now confidently say your retention playbook was responsible for that 10-point improvement. This simple experiment turns your ROI calculation from a hopeful guess into a rock-solid business case.
This is exactly where AI-driven strategies make a huge difference. According to research from McKinsey, this kind of hyper-personalized experience can lead to revenue growth of up to 25% and slash customer acquisition costs in half. By proving your program's financial impact, you're not just justifying its existence—you're securing the resources you need to do even more.
Got Questions About Predictive Retention? We've Got Answers.
Diving into predictive analytics for the first time can feel a bit overwhelming. It's easy to get lost in the jargon, but trust me, the core ideas are more intuitive than you might think. Let's walk through some of the most common questions I hear from teams who are just getting their feet wet with this stuff.
Getting a handle on the practical side of things is the best way to demystify the process and build the confidence to get started.
What Tools Do I *Actually* Need to Start?
Good news: you don't need a huge data science team or a six-figure custom platform right out of the gate. Many teams get incredible value by starting with tools they might already have or can easily adopt.
For example, a lot of modern BI platforms like Tableau or Power BI have some predictive capabilities baked right in, which can be a great place to find your first insights. If your main challenge is just getting all your customer data in one place (a very common problem!), then a Customer Data Platform (CDP) like Segment or Lytics is designed for exactly that.
You could also look at dedicated customer success platforms—think ChurnZero or Catalyst—which often come with churn prediction features ready to go. And for those with engineering muscle, you can’t beat the power and flexibility of open-source Python libraries like Scikit-learn for building your own models from scratch.
How Accurate Does My Churn Prediction Model Need to Be?
This is a big one. It's so easy to get stuck chasing a perfect, 99% accurate model, but that's a classic mistake that just leads to paralysis.
Honestly, a model that's 75-80% accurate is a fantastic starting point for most SaaS businesses. The real goal isn't perfection; it's getting a working model into the hands of your team so they can start taking action. You can always refine it later.
The trick is to balance two key metrics:
- Precision: Of all the customers you flagged as "at-risk," how many were actually at risk? High precision means your team isn't chasing ghosts.
- Recall: Of all the customers who actually ended up churning, how many did your model catch? High recall means you're not letting solvable churn slip through the cracks.
Start with a "good enough" model, learn from its predictions, and iterate. It’s a marathon, not a sprint.
How Long Until I See Any Real Results?
While every business is unique, you can often spot positive leading indicators within the first 30-60 days. These aren't going to be massive MRR swings just yet. Instead, look for things like improved engagement rates or positive replies from customers who received a proactive outreach from your team.
That said, seeing a direct, measurable impact on bottom-line metrics like MRR and your overall churn rate takes a bit more time. You'll generally need a full 3-6 months to collect enough data to prove a real, statistically significant lift.
Be patient. Keep an eye on the early engagement wins to stay motivated, but measure your ultimate success by the long-term impact on revenue.
Ready to stop guessing and start predicting? LowChurn uses AI to analyze your Stripe and product data, identifying at-risk customers 7-30 days before they cancel. Get started in minutes and see a tangible impact on your MRR. Protect your revenue with LowChurn.