Calculating your churn rate means figuring out the percentage of customers or revenue you’ve lost over a set amount of time. The basic formula is pretty simple: divide the number of customers you lost by the number you had at the start of the period, then multiply by 100 to get your percentage.
What Is Churn and Why Is It Your Most Critical Growth Metric?
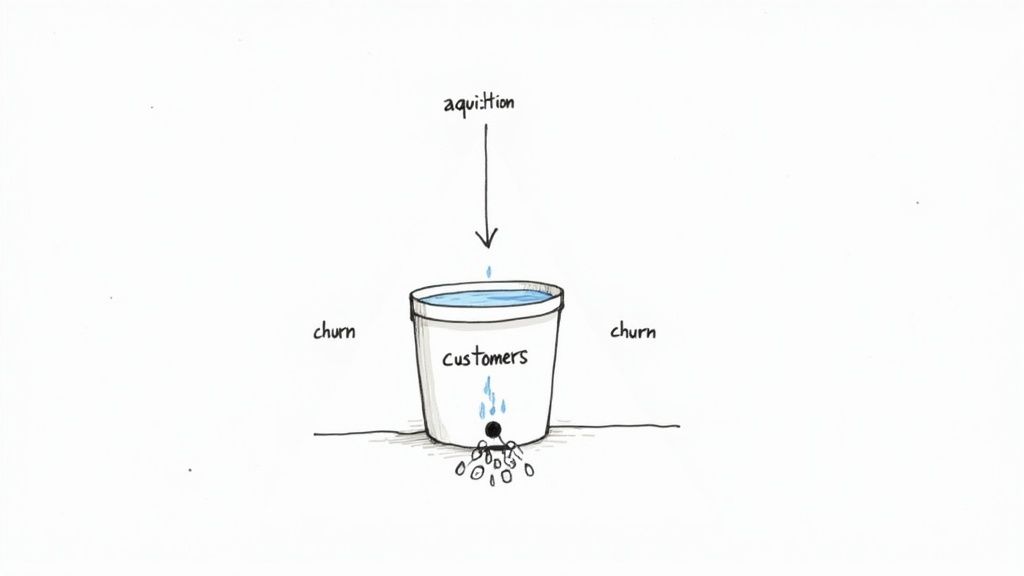
Think of your business as a bucket you're constantly trying to fill. New customers are the water you pour in, but churn is the hole in the bottom of that bucket. No matter how fast you pour water in, you'll never fill it if you're steadily losing it out the bottom. That leak is churn, and it’s one of the most powerful—and often overlooked—forces holding back your growth.
At its core, churn is just the rate at which your subscribers or revenue disappear. But getting an accurate churn rate calculation does more than just track losses; it reveals how sustainable your business really is. It’s a direct measure of customer happiness and whether you've truly found product-market fit.
If your churn rate is high, it’s a glaring sign that customers aren't getting the value they expected from your service. This traps you in a brutal cycle of constantly having to acquire new users just to stand still, let alone grow.
The Two Sides of Churn
It’s crucial to know that not all churn is the same. You need to track two different types because they tell very different stories about the health of your company.
- Customer Churn: This is the one most people think of. It tracks the percentage of individual customers who cancel their subscriptions and answers the question, "How many of our users are leaving?"
- Revenue Churn: This is arguably more important. It tracks the percentage of recurring revenue you lose from both cancellations and downgrades. It answers the real money question: "How much cash are we losing?"
Losing ten customers who were each paying $10 a month is a completely different problem than losing a single enterprise client who was paying $1,000 a month. Customer churn tells you about the volume of people leaving, while revenue churn tells you about their financial impact. You absolutely need both to get the full picture.
For a deeper dive into the overall concept of churn, including how to diagnose and reduce it specifically in a SaaS context, this guide on Understanding Churn in SaaS is a fantastic resource.
A seemingly low 5% monthly churn rate can compound to a staggering 46% loss of your customer base over a single year. This shows why even tiny improvements in retention can have a massive impact on your long-term growth.
Of course, knowing your churn rate is only half the battle; you also need to know what a "good" number looks like. Benchmarks can vary a lot depending on your industry and how mature your business is, but you can explore detailed SaaS churn rate benchmarks here: https://www.lowchurn.com/blog/saas-churn-rate-benchmarks. Ultimately, mastering your churn calculation is the first, non-negotiable step toward building a subscription business that lasts.
The Go-To Formulas for Calculating Customer Churn
Alright, let's move from theory to practice. To actually measure churn, you need a few key formulas. The most basic one is your starting point—a quick pulse check on customer attrition that gives you an immediate sense of your business's health.
At its core, churn calculation is pretty straightforward. You're just comparing the number of customers you lost during a specific time frame to the number you had when that period started. This gives you a raw percentage.
The Basic Churn Rate Formula:
(Customers Lost During Period / Customers at Start of Period) x 100 = Churn Rate %
This formula is dead simple to use, which is why it's the perfect first step for any churn analysis.
Putting the Basic Formula to Work: An Example
Let's say you run a SaaS company called "ProjectFlow" that sells project management software. You want to figure out your churn rate for the month of April.
First, you need two pieces of data:
- Customers at the Start of April: 1,000
- Customers Who Canceled in April: 50
Now, just pop those numbers into the formula:
(50 Lost Customers / 1,000 Starting Customers) x 100 = 5%
Boom. ProjectFlow’s customer churn rate for April was 5%. That single number tells you that for every hundred customers you had on April 1st, five of them were gone by the end of the month. It’s a simple metric, but it’s a vital baseline for tracking how you're doing over time.
Why the Simple Formula Doesn't Tell the Whole Story
While the basic formula is a great starting point, it has a massive blind spot: it completely ignores any new customers you signed up during that same period. If you only look at this number, you can get a skewed picture of what’s really going on.
For example, what if ProjectFlow also managed to sign up 200 new customers in April? The basic formula doesn't see that growth at all. This can easily mask underlying retention problems or make your existing customer base seem more stable than it actually is. This is where you start to see the interplay between churn and overall growth. A customer’s value over their entire relationship is a key concept here, and you can learn more about how to calculate customer lifetime value in our detailed guide.
There are more advanced formulas that account for this, but before we get there, the most important thing is to make sure the data you're using is clean and your definitions are solid.
Get Your Definitions Straight for Accurate Numbers
Before you can trust your churn rate, you have to nail down a couple of key definitions internally. If you don't, your calculations will be all over the place, making it impossible to compare one month to the next.
1. What Exactly Is an "Active Customer"?
Is it anyone with an account? Only paying customers? What about people on a free trial? You have to be specific. For most SaaS companies, the standard definition is any account with an active, paid subscription.
2. When Does a "Churn Event" Actually Happen?
Is a customer churned the second they hit the "cancel" button, or when their subscription period officially ends? And what about failed payments? You need a clear rule for these situations.
A rock-solid definition we recommend is to count a customer as churned only after their subscription officially expires and is not renewed. This keeps you from miscounting customers who cancel mid-month but are technically still active until their billing cycle ends.
By getting everyone on the same page with these definitions, you ensure every churn calculation is an apples-to-apples comparison. This consistency is the bedrock of any good analysis and gives you the confidence to act on the data you see.
Calculating Revenue Churn with Gross and Net MRR
Knowing how many customers you lost is one thing, but knowing how much money walked out the door is what really keeps founders up at night. Losing ten customers on a basic $10/month plan stings, but it’s a totally different problem than losing a single enterprise client paying $1,000/month.
This is exactly why we need to graduate from counting customers to tracking dollars. By focusing on Monthly Recurring Revenue (MRR), you get a much sharper picture of your business's financial health. The question evolves from "How many left?" to "What was the financial impact?" That shift in perspective is crucial for any subscription company.

Gross MRR Churn: The Unfiltered Truth
Gross MRR Churn is your most straightforward revenue loss metric. It measures the total MRR you lost during a period from customers either canceling outright or downgrading to a less expensive plan. Think of it as the unfiltered, sometimes brutal, truth about your revenue leakage.
The formula couldn’t be simpler:
Gross MRR Churn Rate Formula:
(MRR Lost to Cancellations & Downgrades / MRR at Start of Period) x 100 = Gross MRR Churn %
This number is powerful because it's so direct. It shows you exactly how much revenue is draining from your business before you factor in any positive momentum from upgrades or new sales.
Example of Gross MRR Churn
Let's check back in with our example company, "ProjectFlow." They kicked off April with $50,000 in MRR.
Throughout the month, a few things happened:
- Cancellations: They lost $2,000 in MRR from customers who left.
- Downgrades: Existing customers moved to cheaper plans, reducing MRR by $500.
First, we'll add up the total lost MRR: $2,000 + $500 = $2,500.
Now, we just plug that into the formula: ($2,500 Churned MRR / $50,000 Starting MRR) x 100 = 5%
So, ProjectFlow’s Gross MRR Churn Rate for April is 5%. This is far more insightful than just knowing 50 customers left; it quantifies the direct financial hit they took.
Net MRR Churn: The Complete Financial Picture
Gross MRR Churn tells a critical, but incomplete, story. It only focuses on the losses. It completely ignores a key driver of SaaS growth: expansion revenue. This is the extra MRR you earn from your existing customers through upgrades, add-ons, and cross-sells.
Net MRR Churn brings both sides of the coin together. It takes your total revenue churn and then subtracts the expansion revenue you gained over the same period.
Net MRR Churn Rate Formula:
([MRR Lost to Churn & Downgrades] - [Expansion MRR]) / MRR at Start of Period x 100 = Net MRR Churn %
This metric tells you if your existing customer base is, on balance, growing or shrinking in value. It’s a vital indicator of product stickiness and customer health.
To help clarify the distinction, here’s a quick comparison of what each metric tells you.
Gross MRR Churn vs. Net MRR Churn Comparison
| Metric | What It Measures | Formula | Business Implication |
|---|---|---|---|
| Gross MRR Churn | The total revenue lost from cancellations and downgrades. | (Lost MRR / Starting MRR) x 100 |
Shows the raw "leakage" from your revenue bucket. A high number points to issues with product, pricing, or customer fit. |
| Net MRR Churn | The net effect of revenue churn after accounting for expansion revenue from existing customers. | ([Lost MRR - Expansion MRR] / Starting MRR) x 100 |
Reveals the overall momentum of your existing customer base. A low or negative number is a strong sign of a healthy, growing business. |
Looking at both gives you a much richer understanding of your company's performance and long-term stability.
The Magic of Negative Churn
So, what does this look like for ProjectFlow? We know they started with $50,000 in MRR and lost $2,500 to churn and downgrades.
But their customer success team had a great month. They managed to upsell several existing clients, generating $3,000 in Expansion MRR.
Let's run the numbers for Net MRR Churn: ([$2,500 Lost MRR] - [$3,000 Expansion MRR]) / $50,000 Starting MRR x 100 = -1%
ProjectFlow achieved a Net MRR Churn of -1%. This is often called negative churn, and for a subscription business, it's the holy grail. It means the new revenue from existing customers more than made up for the revenue lost from those who left. Essentially, the company is growing even before signing a single new customer.
This also shows why it's so important to distinguish between voluntary churn (customers actively canceling) and involuntary churn (failed payments). One recent industry report found that while SaaS businesses see around 7% voluntary churn monthly, they also see 1% from involuntary churn—and up to 70% of that is recoverable. By focusing on both expansion and recovery, you can make a huge dent in your net churn. You can dig into the full report and learn more about these retention findings.
Common Pitfalls in Churn Calculation and How to Avoid Them
Getting your churn rate wrong is arguably worse than not calculating it at all. A bad number can send you down a rabbit hole, chasing phantom problems while the real issues fester. It’s like trying to navigate with a broken compass; you’re moving, but you’re almost certainly headed in the wrong direction.
To make sure your churn metric is a reliable guide, you have to be aware of the common traps that can easily mess up your numbers. Let's walk through them so you can build a metric you can actually trust for big decisions.
Pitfall 1: Inconsistent Time Periods
One of the most common mistakes I see is comparing churn rates calculated over different time frames. You simply can’t compare a monthly churn rate from January to a quarterly rate from Q2. It's apples and oranges—like comparing a car’s speed in miles per hour to another in kilometers per minute. The units just don't match up.
For instance, a 3% monthly churn might not sound too scary. But if you compound that over a year, you’re looking at losing more than 30% of your entire customer base. The time frame completely changes the story.
How to Avoid It: Pick a lane and stay in it. Decide whether you’ll measure churn monthly, quarterly, or annually, and then be consistent. This is the only way you can spot real trends and make valid comparisons over time.
This kind of discipline ensures that when you see a spike or a dip, it's because of something that actually happened in the business, not just a quirk in your math.
Pitfall 2: Ignoring Customer Segments
A single, company-wide churn rate hides a multitude of sins. It’s a blended average that mashes all your customers together, completely obscuring what’s really going on beneath the surface. You could have one group of die-hard fans and another group leaving in droves, but one number will never tell you that.
This is a huge issue in industries with fierce competition. Take telecom and cable, where annual churn rates in the US have hovered around 25%. That high number is a giant red flag for subscription services. But when you dig in, you almost always find that specific plans or certain types of customers are driving the exodus. You can discover more insights about customer retention rates to see how this pattern repeats across different markets.
To get a truly useful picture, you need to slice and dice your churn by meaningful segments:
- Pricing Plan: Are customers on your entry-level plan churning faster than those on premium tiers? Maybe your basic plan isn't delivering enough value.
- Acquisition Channel: Do customers from paid ads leave more often than those from organic search? This tells you a lot about the quality of leads your marketing channels are generating.
- Signup Date: How do customers who joined in January compare to a cohort from June? This can reveal the impact of a product update or a change to your onboarding flow.
Segmenting your churn transforms it from a vague, top-line metric into a powerful diagnostic tool that pinpoints exactly where your retention strategy is breaking down.
Pitfall 3: Mishandling Annual Contracts
How you handle customers on annual plans can throw a real wrench in your monthly churn reports. Let's say a customer on a yearly subscription decides to cancel in month three. Do you count them as churned right away? If you do, your monthly churn rate spikes artificially, even though you’re still collecting their revenue for another nine months.
On the flip side, if you wait until their contract officially expires to count them as churned, you’re missing a critical, early warning sign. Their intent to leave is valuable intelligence, and you lose it if you wait until the very end of their term.
The Best Approach: Treat cancellations and churn as two distinct events. A "cancellation" is a leading indicator—the customer has raised their hand and told you they plan to leave. "Churn" is the lagging indicator—the moment their subscription actually ends and the revenue stops. By tracking both, you get a real-time pulse on future churn risk while keeping your official churn numbers clean and accurate.
Automating Your Churn Rate Calculation with Stripe Data
Are you still tracking churn in a spreadsheet? If so, you're probably all too familiar with that sinking feeling. It's a bit like bailing out a leaky boat with a teacup—it works for a moment, but as your business grows, the manual exports and VLOOKUPs become a massive, error-prone time sink.
The answer isn't to work harder; it's to work smarter by automating the entire process. For most SaaS businesses, your single source of truth for customer and subscription data is your payment processor, and that usually means Stripe.
Instead of just being a tool to collect payments, Stripe is a goldmine of data. By tapping into its API and data exports, you can build an automated, reliable system for calculating churn. This shift takes you from doing reactive, once-a-month reports to having a near-real-time pulse on the health of your customer base.
Finding the Right Data in Stripe
First things first, you need to know what you’re looking for. Stripe gives you several key signals that a customer is churning. You can find these by doing manual exports, but for a truly automated setup, you’ll want to listen for specific API webhooks.
Here are the critical events you need to monitor:
customer.subscription.deleted: This is your clearest churn signal. It fires the moment a customer's subscription is canceled, whether they did it themselves or you did it for them. This is your primary event for tracking customer churn.customer.subscription.updated: This one is absolutely essential for calculating MRR churn. It triggers whenever a subscription changes—think downgrades (which are a form of churn) or upgrades (which count as expansion MRR).- Failed Payments (
invoice.payment_failed): Think of this as an early warning flare for involuntary churn. While a single failed payment isn't a churn event on its own, tracking these failures shows you exactly how many subscriptions are at risk of being automatically canceled.
By setting up a system to catch and log these events, you can automatically count every customer who leaves and tally the exact MRR lost each month without lifting a finger.
Common Pitfalls You Can Avoid
Even with access to the data, it's easy to get the calculation wrong. A manual or poorly automated process often falls into a few common traps that can completely skew your numbers and lead to bad decisions.
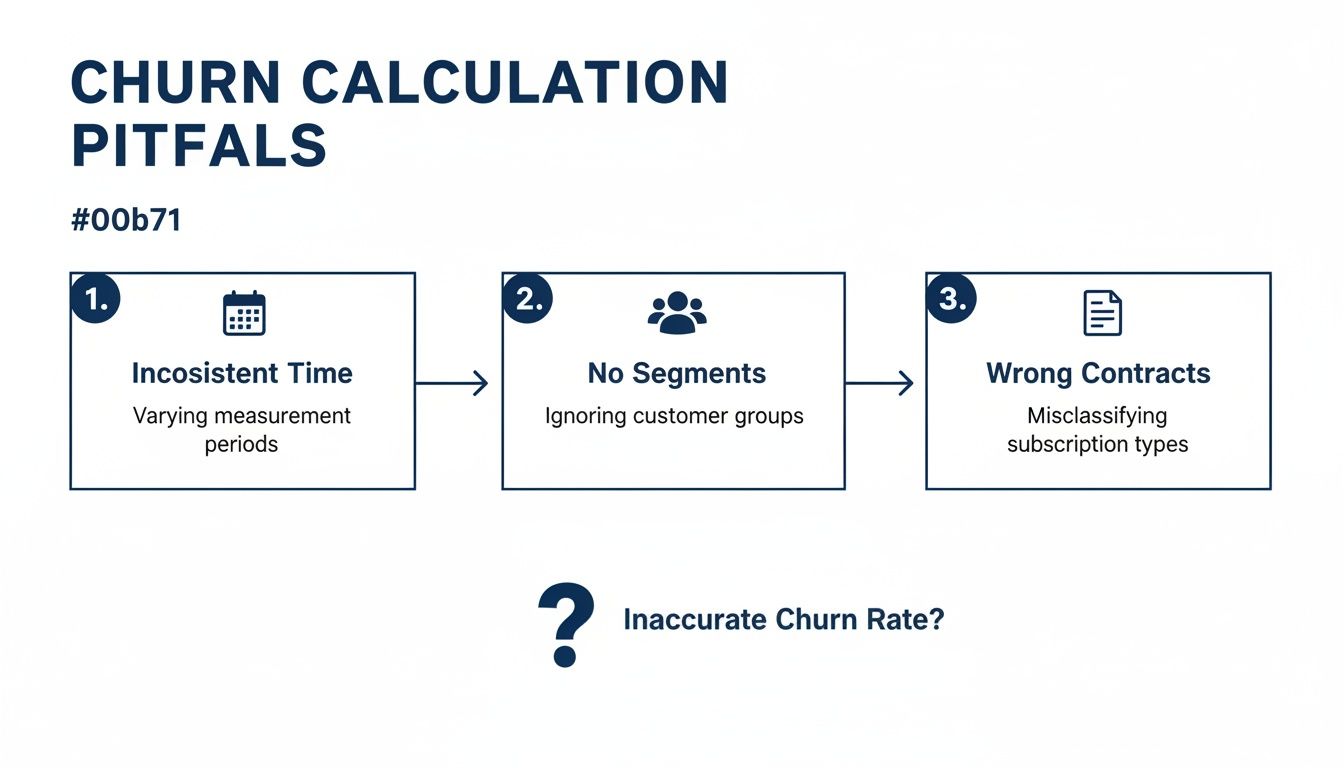
As the diagram shows, things like inconsistent time windows, failing to segment your customers, or misinterpreting contract types will give you a flawed picture of reality. A well-designed automated system helps eliminate these human errors.
Moving Beyond a DIY Setup
Building your own custom integration is a great step forward, but it comes with its own headaches—it requires developer time to build and, more importantly, to maintain. For teams that need accurate churn metrics now without the engineering overhead, specialized analytics tools are the way to go.
Platforms like LowChurn are built for this. You can connect your Stripe account in a few clicks, and it automatically starts pulling, cleaning, and interpreting all those critical events for you. The result is pre-built, easy-to-understand dashboards for both customer and MRR churn.
The real game-changer with a dedicated tool isn't just about calculating what happened in the past. It’s about predicting the future. Instead of just seeing a list of who already churned, these platforms analyze subscription data and user behavior to forecast which customers are likely to churn next, giving you a crucial window to step in and save them.
Turning Your Churn Data Into Actionable Retention Strategies
Calculating your churn rate is a bit like checking the scoreboard at halftime. It’s essential for knowing if you're winning or losing, but that number alone won't tell you how to win the second half. The real magic happens when you turn that static percentage into a dynamic playbook for keeping your customers happy and engaged.
Your churn data is a treasure trove of clues, if you know how to read it. See a sudden spike in cancellations three months after signup? That’s not just a statistic; it’s a giant red flag pointing to a potential weakness in your onboarding. What if you discover that customers who ignore a specific feature are always the first to leave? You've just found a product gap or a failure to communicate that feature's value.
This is the critical mindset shift: stop passively measuring loss and start actively investigating what’s causing it.
Uncovering the "Why" Behind Your Churn
A single, company-wide churn rate tells you what happened, but breaking that data down into segments tells you why. The first step in building a solid retention strategy is to start asking sharper, more targeted questions about your data. If you're looking for a fast way to get these insights, you can learn how to Ask What Drove Churn Last Month Without Writing SQL.
Try looking at your customers through a few different lenses:
- By Cohort: Are customers who joined in Q2 leaving faster than those from Q1? This could signal the impact of a recent pricing change or a buggy product update.
- By Feature Usage: Which features do your stickiest, most loyal customers use every day? And which ones do churned customers consistently neglect?
- By Customer Persona: Are you losing more small businesses than enterprise clients? Maybe your product-market fit isn’t as strong for one of those segments.
Answering these questions transforms raw numbers into a clear roadmap. It points you directly to the areas where your efforts will make the biggest difference.
From Reactive to Proactive Retention
The best SaaS companies don't just react to cancellations—they predict who is at risk of leaving and step in before it's too late. This is where predictive analytics becomes your superpower. By combining your Stripe subscription data with signals from user behavior, you can build a much richer, more dynamic picture of account health.
This proactive approach is grounded in the powerful link between customer experience (CX) and retention. It's not just a theory. One European energy provider, for instance, managed a 15% churn reduction just by improving its customer experience. Happy, well-supported customers simply don't have a reason to leave.
This is exactly what platforms like LowChurn are built for. Instead of just showing you a historical churn number, we help you identify at-risk accounts in real time. We do this by calculating a dynamic customer health score, a metric that blends signals like product usage, support ticket frequency, and payment history into a single, actionable score. To learn more, check out our guide on how to build a powerful customer health score.
This kind of early-warning system empowers your team to engage with struggling customers proactively. You can trigger automated email sequences, notify your customer success managers to make a personal call, or offer a targeted training session to showcase value. It’s how you turn a backward-looking metric into a forward-looking engine for growth.
Answering Your Churn Questions
Even with the right formulas in hand, figuring out what your churn rate actually means can be a bit of a puzzle. Let's tackle some of the most common questions that pop up when you start digging into the numbers.
What Is a Good Churn Rate for a SaaS Business?
This is the million-dollar question, and the honest answer is: it depends entirely on who you sell to. There's no magic number that works for everyone.
For SaaS companies that cater to small and medium-sized businesses (SMBs), a monthly customer churn rate between 3-7% is generally considered acceptable. The SMB market is just naturally more volatile—businesses come and go, so a higher churn rate is part of the territory.
On the other hand, if you're selling to large enterprises, your target should be much, much lower. Aim for under 1% monthly. Enterprise clients sign bigger contracts, stick around for longer, and are harder to replace, so every single departure is a major event.
How Often Should I Calculate Churn?
For most businesses, a monthly calculation hits the sweet spot. It gives you a regular pulse on the health of your customer base, allowing you to catch worrying trends early without overreacting to daily noise.
Quarterly and annual churn rates are fantastic for big-picture thinking—things like strategic planning, board reports, and year-over-year performance reviews. I'd steer clear of daily or weekly calculations, though. The numbers jump around too much to give you a clear, actionable signal.
What Is the Difference Between Attrition and Churn?
People often use these words interchangeably, but there's a subtle distinction that's actually quite useful for analysis.
Churn typically refers to a customer actively choosing to leave, often due to dissatisfaction or switching to a competitor. Attrition is more passive—the customer leaves for reasons you can't really control, like their business shutting down or their needs fundamentally changing.
The math for calculating both is the same. The real value comes from trying to understand why someone left. Was it something you did (churn), or was it just the natural course of their business (attrition)? Segmenting your lost customers this way can tell you whether you have a product problem or if you're just feeling the effects of broader market shifts.
Calculating churn is step one, but stopping it from happening is the real goal. LowChurn plugs into your Stripe data and user behavior, using AI to predict which customers are at risk of leaving before they hit the cancel button. You can finally move from just reporting on the past to proactively protecting your future revenue. Discover how to protect your MRR today.