
When your SaaS business loses a customer, it's called churn. But that simple definition barely scratches the surface of what's arguably the most critical metric for any subscription company. High churn is a clear signal that customers aren't getting the value they paid for, and it can quietly kill your growth.
What Churn in SaaS Really Means for Your Business
Think of your business as a bucket you’re working hard to fill with new customers. Churn is a hole in the bottom of that bucket. No matter how much you pour in, you’re constantly losing what you’ve already gained. It's not just a number on a dashboard; it's a direct threat to your revenue, your growth, and even your company's survival.
To really understand what's happening, you have to look beyond a single churn number. There are two distinct types of churn, and you need to track both to get the full story.
The Two Faces of Churn
First, you have customer churn, which is sometimes called logo churn. This one is pretty simple: it’s the percentage of total customers who cancel their subscription in a specific period. If you begin a month with 100 customers and 5 of them leave, your customer churn rate is 5%.
But that number can be misleading. That’s where the second, and arguably more important, metric comes in: revenue churn. This measures the total Monthly Recurring Revenue (MRR) you lose from customers canceling or downgrading their plans. Losing one enterprise customer paying $10,000/month hurts a lot more than losing ten small startups paying $50/month each. Revenue churn tells you the real financial story.
Churn is the ultimate measure of whether your product delivers on its promise. It’s the market’s feedback loop, telling you exactly where your value proposition is falling short for a specific segment of users.
Why It Is More Than Just a Number
At its core, a high churn rate points to a fundamental problem with customer satisfaction or a weak product-market fit. It means your product isn't helping customers achieve what they set out to do. This creates a ripple effect of negative consequences:
- It Stalls Growth: When churn is high, all your new customer acquisition efforts are just replacing the ones you lost. You're essentially running on a treadmill, working hard just to stay in the same place instead of actually growing.
- It Increases Acquisition Costs: Your "leaky bucket" forces you to spend more on marketing and sales just to maintain your customer base, which eats directly into your profits.
- It Damages Your Reputation: Unhappy customers talk. Their negative word-of-mouth can poison the well, making it much harder and more expensive to attract new customers in the future.
The good news is that SaaS companies are getting smarter about this. As of mid-2024, the average monthly churn rate for B2B SaaS businesses has fallen to about 3.5%, a major improvement from the 7.5% peak back in late 2021. For top-tier companies, an annual churn rate below 5% is the gold standard. Discover more insights about these SaaS statistics.
How to Accurately Calculate Your Churn Rate
Knowing that churn is a leak in your business is one thing. Actually measuring how much you’re losing is where the real work begins. To get a clear picture, you have to move beyond a single, overly simple percentage and get comfortable with the formulas that truly reveal the health of your SaaS company. Think of these calculations as your most important diagnostic tools.
This diagram breaks down how losing customers translates directly into lost revenue—the two sides of the same churn coin.
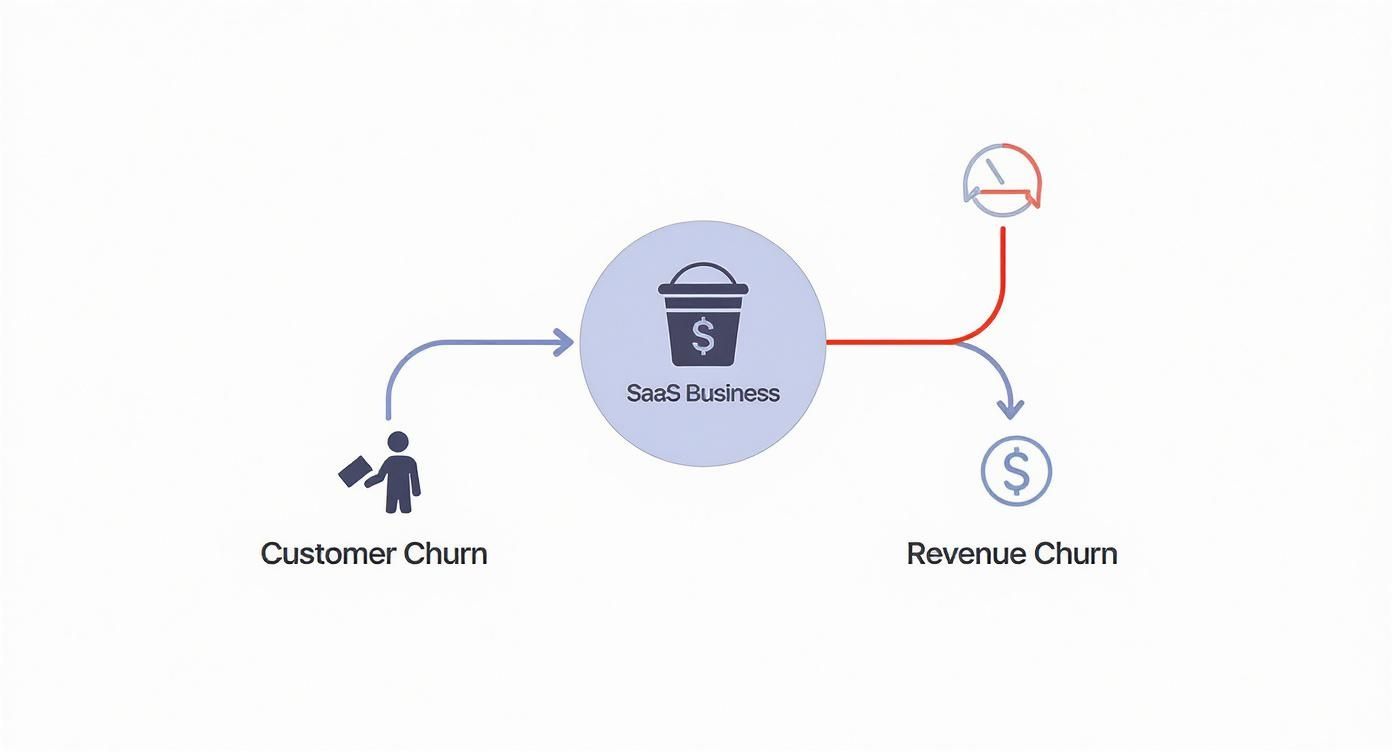
As you can see, churn isn't just a one-off event. It's a chain reaction where departing customers (logo churn) inevitably drain your revenue (revenue churn), which can destabilize the entire business if left unchecked.
Calculating Customer Churn Rate
The most basic metric is the Customer Churn Rate, often called logo churn. It's a straightforward calculation that tells you the percentage of your customers who canceled their subscriptions during a specific period.
The formula is pretty simple:
Customer Churn Rate = (Number of Customers Who Canceled / Total Customers at Start of Period) x 100
Let's say you started April with 500 customers. During that month, 25 of them decided to cancel. Your calculation would be (25 / 500) x 100, which gives you a 5% customer churn rate for April. This number is a good starting point for understanding how many customers you're losing.
Calculating MRR Churn Rate
While knowing how many logos you've lost is useful, the MRR Churn Rate (Monthly Recurring Revenue) gives you a much clearer sense of the financial damage. It measures the percentage of revenue you’ve lost from cancellations and downgrades.
Here’s the basic formula for Gross MRR Churn:
- Gross MRR Churn Rate = (MRR Lost from Churned/Downgraded Customers / Total MRR at Start of Period) x 100
Let's go back to our example. Imagine those 25 churned customers were paying a total of $5,000 in MRR. If you started the month with $100,000 in total MRR, your Gross MRR Churn Rate would be ($5,000 / $100,000) x 100 = 5%. This tells you the direct hit your revenue took.
This distinction is crucial. Data from the 2025 Recurly Churn Report pegs the average B2B SaaS churn rate at 3.5%. This is further broken down into 2.6% from voluntary churn (active cancellations) and 0.8% from involuntary churn (like failed payments). Knowing which is which helps you focus your retention efforts where they’ll have the biggest impact.
Gross Churn vs Net Churn
The story gets even more interesting when you factor in the revenue growth you're generating from your existing customers. This is where Net MRR Churn enters the picture. It accounts for expansion MRR—all the additional revenue from current customers upgrading, buying add-ons, or adding more seats.
Here’s how you calculate it:
- Net MRR Churn Rate = ((MRR Lost - Expansion MRR) / Total MRR at Start of Period) x 100
Let’s stick with our example. You lost $5,000 in MRR from churned customers, but you also gained $3,000 in expansion MRR from loyal customers who upgraded their plans. The new calculation is (($5,000 - $3,000) / $100,000) x 100 = 2%.
Suddenly, your Net MRR Churn Rate is only 2%, which looks a lot healthier than the 5% gross rate. But be careful—this can be a double-edged sword. While expansion revenue is a fantastic sign of a healthy business, a low net churn figure can easily mask a high gross churn rate, hiding serious problems with customer satisfaction.
You need to track both to get the full story. For a more detailed walkthrough, our guide on How to Calculate Churn Rate Accurately breaks down the methodology step-by-step.
Key Churn Metrics and Formulas for SaaS
To keep these concepts straight, here's a quick-reference table outlining the primary types of churn, their formulas, and what each one really tells you about your business.
| Metric | Formula | What It Tells You |
|---|---|---|
| Customer Churn Rate | (Customers Lost / Total Customers at Start) x 100 | The percentage of your customer base you lost over a period. Good for tracking volume. |
| Gross MRR Churn Rate | (MRR Lost from Churn & Downgrades / Total MRR at Start) x 100 | The direct financial impact of customer cancellations and downgrades on your top-line revenue. |
| Net MRR Churn Rate | ((MRR Lost - Expansion MRR) / Total MRR at Start) x 100 | Your overall revenue momentum from your existing customer base, factoring in both losses and gains. |
Tracking all three metrics provides a comprehensive dashboard of your company's retention health, preventing any single number from giving you a false sense of security.
What’s a “Good” Churn Rate, Anyway? Benchmarking Your SaaS
So, you’ve calculated your churn rate. The next question is always, "Is this good or bad?" The honest answer? It depends. There’s no magic number for what counts as "good" churn because your business context is everything.
Comparing your rate without considering your company's stage or customer type is like a sprinter comparing their 100-meter dash time to a marathon runner's. Both are athletes, but they’re running completely different races.
Company Stage Makes a Huge Difference
A young startup is still dialing in its ideal customer profile and iterating on the product. It's completely normal to sign up users who aren't a perfect fit, which naturally leads to higher churn. Think of it as a necessary part of finding your footing. An established company, on the other hand, has a much clearer sense of product-market fit and serves customers with deeper, more embedded needs.
This plays out clearly in the data. Smaller SaaS companies—those with under $10 million in annual revenue—often see a median annual churn of around 20%. Some early-stage startups even see rates as high as 60% while they figure things out. In contrast, larger firms pulling in over $10 million report much lower annual churn, typically closer to 8.5%. You can dig into more of these SaaS statistics and what they mean for your business.
The goal isn't just to get the number down. It's to understand the story behind it. High churn in a startup can be a valuable signal that helps you find your market. That same rate in a mature company could signal a full-blown crisis.
Your Target Market Is Just as Important
Who you sell to dictates so much about your business, and churn is no exception. The dynamics of selling to a small local business versus a Fortune 500 company are worlds apart, and your churn benchmarks should reflect that reality.
Here's a quick breakdown:
- SMB Customers: Small and medium-sized businesses have tighter budgets and are more agile. They can switch providers if a better deal comes along and, unfortunately, are more likely to go out of business. This leads to a naturally higher monthly churn, usually in the 3-7% range.
- Enterprise Customers: These giants sign multi-year contracts and weave your product deep into their daily operations. The cost and pain of switching are massive—think retraining thousands of people and migrating terabytes of data. As a result, enterprise-focused SaaS companies can achieve incredibly low annual churn, often below 1%, and frequently hit negative MRR churn as existing accounts expand.
Knowing these differences is crucial. If you serve SMBs, chasing a sub-1% churn rate will only lead to frustration. The smarter move is to benchmark yourself against companies with a similar customer base and set realistic goals from there.
To help you get a better feel for where you might stand, here’s a look at typical churn rates across different SaaS business models.
Typical Annual Churn Rates by SaaS Business Model
A comparative look at average annual churn rates across different SaaS customer segments, helping you benchmark your own performance.
| Customer Segment | Typical Annual Churn Rate | Key Influencing Factors |
|---|---|---|
| SMB (Self-Service) | 30-60% | High-volume, low-touch model. Customers have low switching costs and are sensitive to price. |
| Mid-Market | 10-25% | A mix of high-touch and self-service. Contracts are often annual, providing more stability than SMBs. |
| Enterprise | 5-10% | Long-term contracts, deep product integration, and high switching costs create very "sticky" customers. |
| Varies by Vertical | Varies Widely | Industry-specific factors can play a huge role. For example, a tool for seasonal businesses may see predictable churn spikes. |
Keep in mind that these are just general guidelines. The real value comes from tracking your own churn rate over time and understanding the specific reasons customers decide to leave your service.
So, Why Are Your Customers Actually Leaving?
Getting your churn rate is just the start. That number tells you what is happening, but the real million-dollar question is why. Customer churn in SaaS isn't a random event—it's the last step in a long, predictable journey of disengagement.
Think of it like smoke signaling a fire. By the time you see a customer cancel, the problem has been smoldering for weeks or even months. To stop churn, you have to find and put out these small fires before they become infernos.
This means you need to stop reacting to cancellations and start proactively diagnosing the root causes. Customers don't just wake up one day and decide to leave. Their decision comes from a slow build-up of friction, unmet expectations, and the feeling that your product just isn't worth it anymore.
Let's break down the most common culprits.
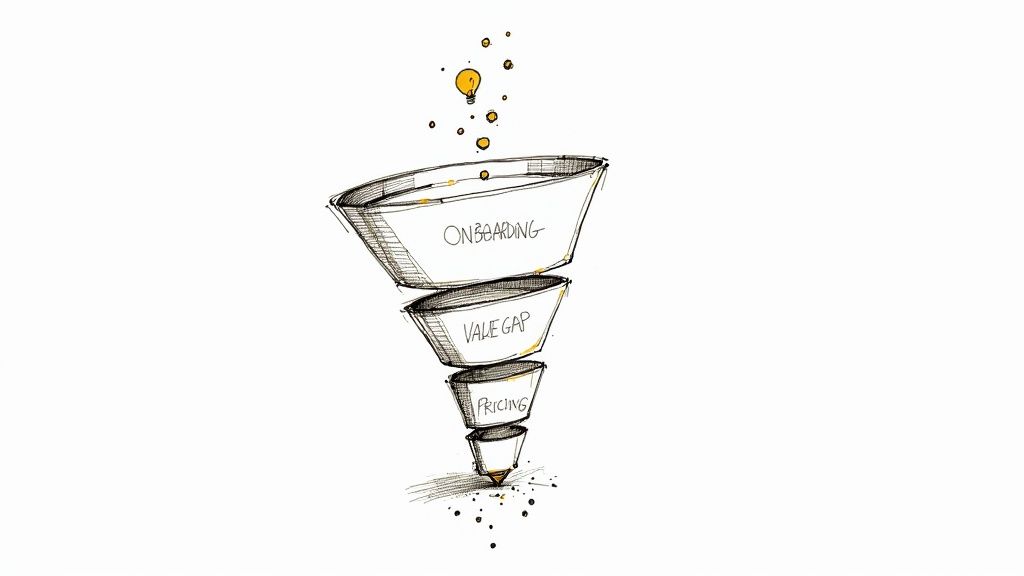
A Flawed Onboarding Experience
You only get one chance to make a first impression. A clunky, confusing, or unguided onboarding process is probably the fastest way to lose someone you just won over.
When a user signs up, they have a very specific goal in mind. They're excited. If they can't figure out how to get that first quick "win" and solve their immediate problem, that excitement quickly turns into frustration. Suddenly, your amazing tool feels like homework. This is a huge driver of early-stage churn, often striking within the first 90 days.
Early Warning Signs:
- Low Feature Adoption: New users are only touching one or two basic features, completely ignoring the powerful stuff they're paying for.
- Incomplete Setup: They never finish critical steps, like inviting teammates, connecting their calendar, or integrating other essential tools.
- Rapid Drop-off in Logins: You see a flurry of activity for a day or two, then... crickets. Login frequency nosedives.
The dreaded "Value Gap"
Okay, so they made it through onboarding. Now what? The next big hurdle is making sure customers keep getting value from your product week after week. This is where the "value gap" appears—it's the chasm between what your product can do and what the customer is actually doing with it.
If they aren't using the features that deliver a clear ROI, your tool gets demoted from a "must-have" to a "nice-to-have." And you know what happens to nice-to-haves when the budget gets tight? They're first on the chopping block. The customer isn't leaving because your product is bad; they're leaving because they never truly wove it into their daily workflow to unlock its real power.
Poor Customer Service and Support
When a user hits a snag, your support team is their lifeline. A slow, unhelpful, or just plain indifferent support experience can torch an otherwise healthy customer relationship.
It doesn't matter how great your product is. If a customer feels ignored or dismissed when they need help, that negative feeling sticks. This gets even worse when they have to re-explain their problem to three different support agents. A single bad interaction can wipe out months of goodwill.
A great way to get ahead of this is by tracking a customer health score. This metric bundles together data points like product usage, support tickets, and survey feedback to flag at-risk accounts before they hit the cancel button.
Misalignment on Pricing and Value
Sometimes, it really does just come down to money. If a customer believes the price they're paying is higher than the value they're getting, they'll start shopping around. It’s only a matter of time.
This price-to-value mismatch usually happens for a few key reasons:
- Wrong Plan: The customer is on a tier packed with features they don't use, making them feel like they're overpaying.
- Competitor Pricing: A competitor swoops in offering a similar (or "good enough") product for a much lower price.
- Budget Cuts: Their own business hits a rough patch, forcing them to slash expenses across the board.
Catching these warning signs early gives your team a chance to step in. You can offer targeted training, suggest a better plan for their needs, or proactively reach out to solve a lingering support issue. These moments can turn a potential cancellation into a reason for them to stay loyal.
Practical Ways to Proactively Reduce Churn
Alright, you've diagnosed the problem by measuring your churn rates. Now it's time to start the treatment. Fighting churn isn't about one magic bullet; it’s about making a series of smart, intentional improvements across the entire customer journey. Think of each strategy as another layer of defense against the reasons customers leave.
This battle starts the second a user signs up. From that point on, it’s a constant effort to prove your value, listen to what they're saying, and build a real relationship. The ultimate goal? To make your product so essential to their work that they can't imagine their life without it.

Redesign Your Onboarding for a Quick First Win
A confusing start is a one-way ticket to cancellation. The most important job of your onboarding process is to get new users to their "Aha!" moment—fast. This is that first real win where they see your product's core value and think, "Yes, this is exactly what I needed."
Stop giving them the grand tour of every single feature. Instead, focus the entire onboarding flow on helping them complete one critical task. If you have a project management tool, that means creating their first project. For an email platform, it’s sending their first campaign. Getting this right is one of the most effective things you can do for retention.
Drive Continuous Engagement and Product Adoption
Once the initial excitement fades, the real work begins. You have to keep proving your product's worth, day in and day out. This is where ongoing education and helpful in-app nudges are so important.
Go beyond one-off tutorials. Build a resource center packed with advanced guides, host webinars to show off new features, and use tooltips to point out powerful functions users may have missed. The idea is to keep them learning and finding new ways to solve their problems with your tool, making it stickier over time. To do this well, you need a strong grasp of the customer journey, which is a core component of effective customer lifecycle management.
Use Smart Pricing to Encourage Commitment
Your pricing isn't just about revenue; it's a powerful tool for retention. How you structure your subscription plans can make a huge difference in how long customers stay. One of the simplest and most effective tactics is to incentivize annual plans.
Offering a meaningful discount—usually 10-20%—for an annual subscription creates a powerful psychological shift. It transforms the renewal decision from a monthly consideration into a single, yearly event, dramatically reducing the opportunities for a customer to churn.
This simple change locks in revenue for a full year and gives you a much longer runway to demonstrate your product's value and solidify the relationship. It's a win-win that boosts both your cash flow and your retention rate.
Build a Powerful Feedback Loop with Exit Surveys
Even if you do everything right, some customers will still leave. That's okay. But every single cancellation is a learning opportunity you can't afford to waste. An exit survey isn't optional—it's a must-have for any SaaS business that's serious about growth.
Keep it simple. Just ask one or two direct questions:
- What was the primary reason you decided to cancel?
- What could we have done differently to keep you as a customer?
The answers you get are pure gold. This is unfiltered feedback on your product's weak spots, pricing problems, or where your competitors are beating you. This data helps you spot trends and fix the root causes of churn, preventing others from leaving for the same reasons. For more ideas, you can explore various strategies to effectively reduce customer churn that build on this kind of direct feedback.
Using Predictive AI to Get Ahead of Churn
Trying to spot churn signals by hand is like trying to hear a single conversation in a loud, crowded stadium. You might catch a few words, but you're going to miss the vast majority of what's happening. Thankfully, we have a much better way to do this now.
Predictive AI is completely changing how SaaS companies fight churn. It's shifting the game from a reactive, fire-fighting scramble to a proactive, data-informed strategy.
Instead of waiting for a customer to stop logging in or send a complaint, AI algorithms crunch massive amounts of data in real-time. They can connect the dots between behaviors that might seem totally unrelated to a human—like a small dip in how often a user logs in, a subtle change in the features they use, or even the type of support tickets they submit.
How AI Predicts Customer Churn
At its core, an AI churn prediction model learns what "at-risk" behavior actually looks like for your specific customers. It digs through all your historical data, analyzing thousands of users who have churned in the past to identify the faint, early patterns that preceded their departure. These are signals a person could never hope to spot on their own.
This gives your customer success team a heads-up long before a customer is actively thinking about canceling. This data-backed early warning system is exactly what you need to step in and make a real difference. You can dive deeper into how these models are built with a solid framework for customer churn prediction.
Predictive AI doesn’t just tell you who might churn; it gives you the crucial head start to figure out why and then step in with the right solution at the right time. It turns your retention strategy from guesswork into a science.
When these tools plug directly into payment platforms like Stripe, the insights get even more powerful. For instance, they can flag accounts that are at high risk of involuntary churn because of recurring payment failures. This gives your team a window to fix the billing issue before the subscription is automatically cut off.
Here’s an example from Stripe’s own documentation showing how it surfaces at-risk revenue from potential churn.
This kind of dashboard makes the financial impact of potential churn crystal clear, helping teams decide which accounts to focus on based on MRR. By blending product usage data with these financial signals, AI hands your team a prioritized list of customers who need attention right now, along with the context you need to save them.
Your SaaS Churn Questions, Answered
Even with a solid grasp of the basics, putting churn reduction into practice always brings up a few tricky questions. Let's tackle some of the most common ones I hear from founders and growth leaders.
What’s a Good SaaS Churn Rate, Really?
There’s no magic number here—"good" depends entirely on who you sell to. But as a rule of thumb, a healthy, established B2B SaaS company should be aiming for an annual churn rate of 5-7%.
Things get a bit more nuanced from there.
- If you're selling to SMBs, a monthly churn rate of 3-5% is pretty standard. Their budgets are smaller and they switch tools more often.
- If you're in the enterprise world, the bar is much higher. You should be shooting for an annual churn rate well below 1%. These deals are sticky, and losing one hurts.
How Can I Tell the Difference Between Voluntary and Involuntary Churn?
Knowing why a customer churned is half the battle. Voluntary churn is when a customer actively chooses to leave. They hit the "cancel" button on purpose. This is usually a sign of a deeper problem—maybe they had a terrible onboarding, couldn't figure out the product, or got a better offer from a competitor.
Involuntary churn, on the other hand, is completely accidental. The customer didn't mean to leave; their payment just failed. This is usually due to an expired credit card, insufficient funds, or a random bank decline. The good news is that this type of churn is much easier to fix with the right dunning and payment recovery tools.
When Is the Best Time to Measure Churn?
The most important thing is to be consistent. That said, most SaaS companies track churn on both a monthly and annual basis. Monthly tracking is your pulse check. It helps you see what's happening right now and catch worrying trends before they spiral out of control.
Annual tracking gives you that bigger-picture view, smoothing out the random ups and downs of any given month. I also highly recommend using cohort analysis—grouping customers by their signup month—to see how retention evolves over time. It’s the best way to see exactly when and where people are dropping off in their journey with you.
The best strategy? Monitor both. Use monthly reports to make quick, tactical adjustments, and use annual and cohort views to shape your long-term retention strategy.
Is Negative Churn Actually a Real Thing?
Absolutely, and it's the holy grail of SaaS. Negative churn is what happens when the new revenue you get from your existing customers is greater than the revenue you lose from the customers who cancel.
Think about it this way: say you lose $5,000 in MRR from a few customers who canceled this month. But during that same month, your happy, loyal customers upgraded their plans, added more users, or bought add-ons, generating $7,000 in new revenue. Your net MRR churn is actually -$2,000.
When you hit this point, your customer base becomes its own growth engine. It’s a powerful sign that your product is delivering massive value and your customer relationships are rock-solid.
Ready to stop guessing and start predicting which customers will leave? LowChurn uses AI to identify at-risk accounts 7–30 days in advance, giving you the time and tools to save them. Connect Stripe in one click and see how at https://www.lowchurn.com.