Think of client retention metrics as the pulse of your SaaS business. While acquisition numbers tell you how many new people are walking in the door, retention metrics tell you if they're happy enough to stay. They reveal the health of your existing customer base—the real engine behind sustainable, long-term growth.
Why Client Retention Metrics Are Your Growth Engine
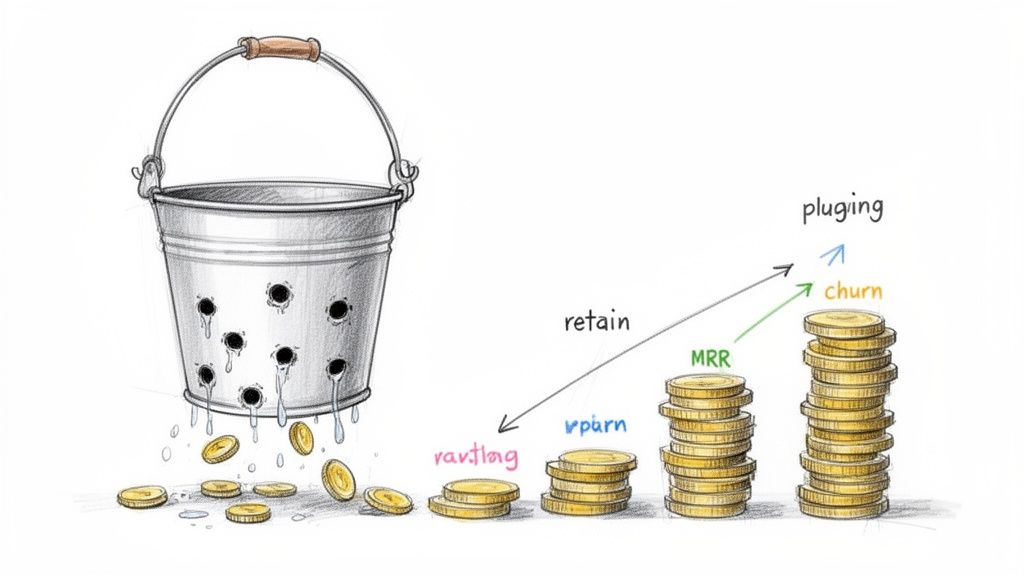
For any SaaS company, especially those running on Stripe, focusing only on signing up new users is like pouring water into a leaky bucket. Sure, you're adding new customers, but if your existing ones are slipping away, you're just treading water. At worst, you're actually going backward.
This is where client retention metrics come in. They shift your strategy from frantically patching holes to proactively building a stronger bucket. These aren't just fancy numbers for a dashboard; they’re the key to unlocking profitability and predictable revenue by helping you plug those leaks for good.
The High Cost of Neglecting Retention
The numbers don't lie. Shifting just a small amount of focus from acquisition to retention has an outsized impact on your bottom line. Here’s a quick look at why ignoring retention is a costly mistake.
| Focus Area | Key Statistic | Business Implication |
|---|---|---|
| Cost of Acquisition | It costs 5 to 7 times more to acquire a new customer than to retain an existing one. | Your marketing and sales budget goes much further when focused on keeping the customers you already have. |
| Profitability | A 5% increase in customer retention can lead to a 25% to 95% increase in profit. | Small improvements in retention have a massive, compounding effect on your profitability over time. |
| Customer Spending | Existing customers are 50% more likely to try new products and spend 31% more than new customers. | Your best source of expansion revenue is sitting right in your existing customer base. |
These figures show a clear picture: a retention-focused strategy isn't just a "nice-to-have," it's a financial necessity for building a resilient business.
By tracking the right metrics, you move from guessing games to high-impact activities that build loyalty. This creates a powerful growth loop where happy customers not only stay longer but also spend more and even become advocates for your brand.
Key Takeaway: Client retention metrics aren't just about minimizing churn. They are about building a profitable business model where your existing customers become your most valuable asset.
From Data to Actionable Insights
Ultimately, tracking these numbers gives you clarity. Without them, you're flying blind, making critical decisions based on gut feelings instead of hard evidence. A solid grasp of your retention metrics helps you answer the questions that will shape your company's future:
- Which customers stick around the longest? This helps you refine your ideal customer profile and sharpen your marketing.
- Where do users get stuck or frustrated? This pinpoints exactly where to focus your product and customer success efforts.
- What's the true value of a customer over time? Understanding this guides how much you can afford to spend on acquisition and support. Digging into what Customer Lifetime Value (CLTV) is provides a much deeper look at this crucial concept.
By the end of this guide, you’ll not only know how to measure these key indicators but also how to listen to the stories they tell—and turn those insights into a powerful strategy that fuels your company's growth.
The Four Core Metrics Every SaaS Must Track
If you want to build a SaaS business that lasts, you have to know how it's really doing. Forget the vanity metrics for a moment. We need to look at the vital signs—the core numbers that tell you the true story of your company's health.
Think of these four metrics as your foundational toolkit. They cut through the noise to give you a clear picture of customer loyalty, financial stability, and true growth potential. Once you get a handle on them, you can start making decisions based on data, not just gut feelings.
Let's break each one down, complete with the formulas you need and some real-world context, so you can start tracking them with your Stripe data today.
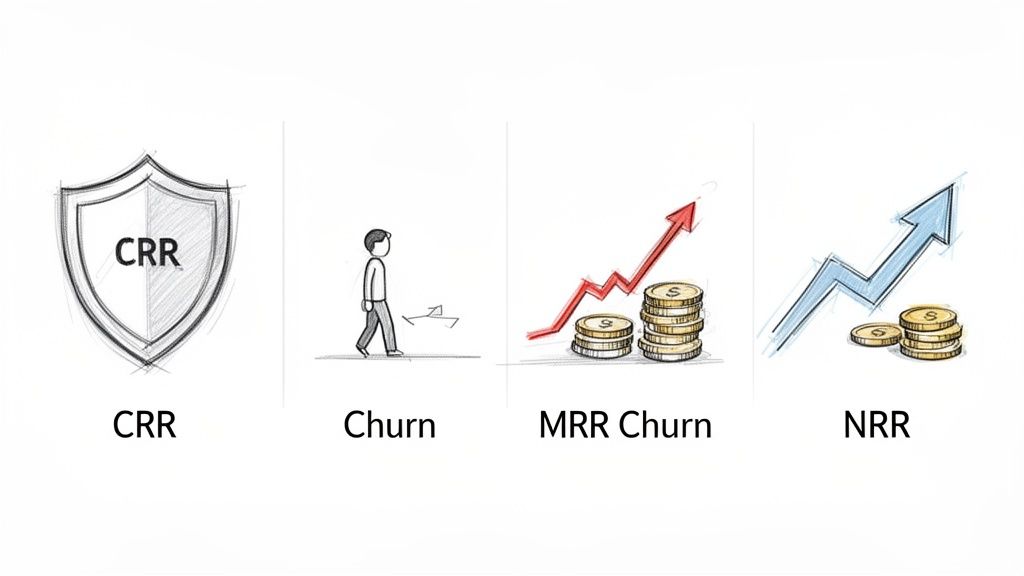
Customer Retention Rate (CRR)
Your Customer Retention Rate (CRR) is the ultimate loyalty score. It tells you, in simple terms, what percentage of your customers stuck around over a certain period. A high CRR is one of the strongest signals you have that your product is consistently delivering value.
Imagine you own a coffee shop. CRR is how you'd measure the number of regulars who were coming in at the start of the month and are still showing up at the end. It's a direct reflection of how well you're keeping your promises.
To calculate it, you just need three pieces of information for a given period (like a month or quarter):
- S: The number of customers you had at the Start.
- E: The number of customers you had at the End.
- N: The number of New customers you signed up.
The Formula: CRR = [(E - N) / S] x 100
For most SaaS businesses, a healthy CRR is anything above 90%. The top-tier companies often hit 95% or even higher.
Customer Churn Rate
While CRR shows you who stayed, Customer Churn Rate focuses on who left. It's the other side of the retention coin, showing the percentage of customers who cancelled their subscriptions during that same period. You have to watch this number closely because it quantifies the "leaks" in your customer bucket.
A high churn rate can point to all sorts of problems—maybe with your product, your onboarding flow, or your customer support. To dig deeper, check out our guide on how to accurately calculate your churn rate and what it says about your business.
The formula here is refreshingly simple:
- CL: The number of Customers Lost during the period.
- S: The number of customers you had at the Start.
The Formula: Churn Rate = (CL / S) x 100
What's a "good" churn rate? It varies by industry, but a solid benchmark for SaaS is to keep your monthly churn below 5%.
Monthly Recurring Revenue (MRR) Churn
Let's be honest: not all churn is created equal. Losing a small startup that was paying $20/month has a very different financial sting than losing an enterprise client paying $2,000/month. That's exactly why MRR Churn is so crucial.
This metric measures the total dollar amount of monthly recurring revenue you lost from those canceled subscriptions. It turns the abstract idea of "customer churn" into a hard financial figure, showing you the real monetary pain. Tracking MRR Churn helps you prioritize saving your most valuable accounts.
Net Revenue Retention (NRR)
This is the one investors love to see. Net Revenue Retention (NRR) is arguably the gold standard for measuring the health of a modern SaaS company. It calculates the total change in recurring revenue from your existing customers, factoring in both the money you lost from churn and the new money you gained from expansion (upgrades, add-ons, cross-sells).
An NRR over 100% is the magic number. It means your existing customers are spending more with you over time, and that growth is more than making up for the revenue you lose from cancellations. This is a powerful engine for sustainable growth and a clear sign that you’ve found true product-market fit.
Essential SaaS Retention Metrics and Formulas
To make things easy, here’s a quick-reference table that pulls these core metrics together. Think of it as your cheat sheet for understanding the financial health of your customer base.
| Metric | Formula | What It Measures |
|---|---|---|
| Customer Retention Rate (CRR) | [(E - N) / S] x 100 | The percentage of customers who stick with you. |
| Customer Churn Rate | (CL / S) x 100 | The percentage of customers you lose. |
| MRR Churn | Sum of MRR from Lost Customers | The total revenue lost from cancellations. |
| Net Revenue Retention (NRR) | (Starting MRR + Expansion - Churn) / Starting MRR | The total revenue growth from your existing customers. |
Getting these four numbers dialed in is the first, most important step toward building a truly resilient business. They give you the clarity needed to not just survive, but thrive.
Unlocking Deeper Insights with Advanced Metrics
Once you’ve got a handle on the basic numbers, it’s time to dig deeper. This next layer of client retention metrics goes beyond simply counting customers and dollars; it starts to explain the why behind those numbers. This is how you shift from just tracking your business’s health to actually predicting its future.
Think of it this way: your core metrics are like the vital signs your doctor takes—heart rate, blood pressure, temperature. They tell you if something is off. Advanced metrics are the diagnostic tests—the X-rays and blood work that reveal the underlying conditions causing those symptoms. They help you slice up your data, spot hidden trends, and make far more strategic calls.
Distinguishing Logo Churn from Revenue Churn
It’s a classic mistake to treat all churn as equal. Losing one customer is rarely the same as losing another, and this is where the difference between Logo Churn and Revenue Churn becomes so important.
Logo Churn (often just called Customer Churn) is a straight headcount. How many customer accounts did you lose? If you started the month with 100 customers and 5 left, your Logo Churn is 5%. It’s a good, simple gauge of your product's overall stickiness.
Revenue Churn, on the other hand, measures the monthly recurring revenue (MRR) you lost from those departing customers. It’s all about the financial impact.
Here’s why you absolutely need both:
- Scenario A: You lose five small startups, each paying $20/month. Your Logo Churn is 5%, and your Revenue Churn is $100. Not great, but manageable.
- Scenario B: You lose one massive enterprise client paying $5,000/month. Your Logo Churn is only 1%, but your Revenue Churn is a painful $5,000.
If you were only watching Logo Churn, Scenario B would look like a victory. In reality, your business just took a major hit. Tracking both gives you the full story, showing you whether you're losing high-value whales or low-value minnows.
Pinpointing Trends with Cohort Analysis
Cohort Analysis is hands-down one of the most powerful tools for understanding how customers behave over time. A "cohort" is just a fancy term for a group of users who share a common trait, usually the month they signed up. Instead of viewing your entire customer base as one giant, messy blob, you track the journey of specific groups.
For example, you can pit the "January 2024 Cohort" against the "February 2024 Cohort."
By isolating these groups, you can finally answer critical questions like: Did the customers who went through our new onboarding flow stick around longer? Are users we got from that LinkedIn campaign churning faster than everyone else?
This technique transforms your retention data from a flat number into a rich, multi-layered story. It reveals how changes you make to your product, pricing, or marketing directly affect how long different types of customers stay with you.
Predicting Future Success with Customer Lifetime Value
Finally, we have Customer Lifetime Value (LTV). This is a predictive metric that estimates the total revenue you can expect from a single customer over their entire relationship with you. It forces you to stop thinking in terms of monthly revenue and start focusing on long-term health and profitability.
Knowing your LTV helps you make much smarter decisions, especially when it comes to what you spend on customer acquisition costs (CAC). If you know the average customer will generate $2,000 over their lifetime, you suddenly have a very clear benchmark for how much you can afford to spend to get them in the door.
A simple formula for LTV is:
LTV = Average Revenue Per Account (ARPA) / Customer Churn Rate
So, if your ARPA is $100/month and your monthly churn rate is 5% (0.05), your LTV is $2,000. This calculation gives you a powerful forecast of the future revenue already locked into your current customer base.
Getting comfortable with these advanced client retention metrics is how you build a predictable growth engine. They provide the context you need to move from putting out fires to strategically building a stronger business. If you want to take this even further, check out our guide on using predictive analytics for customer retention to see churn coming before it even happens.
How to Visualize Retention Data and Drive Action
Calculating your client retention metrics is one thing, but numbers gathering dust in a spreadsheet won't save a single customer. To really get a feel for what's happening, you have to bring those numbers to life. A good dashboard turns a confusing jumble of figures into a clear story your whole team can understand and act on.
Think about it this way: a recipe is just a list of ingredients, but a photo of the finished dish is what gets your mouth watering. Visualizations do the exact same thing for your data, making abstract ideas like "churn rate" feel urgent and real. They close the gap between knowing your numbers and knowing what to do about them.
In the world of SaaS, that speed is everything. The brutal reality is that most products only keep about 39% of their users after the first month, and that number shrinks to just 30% by month three. That means for every 100 people who sign up, more than 60 are gone in 30 days—a silent killer for any team trying to grow. You can dig into more user retention benchmarks to see just how steep that cliff can be.
Creating a Powerful Retention Dashboard
The aim here is to build a single source of truth—one central place that tells the complete story of your customer health. But not all charts are created equal. You need to pick the right tool for the job to make your data pop.
Here are a few classic pairings that just work:
- Line Charts for Churn Over Time: Nothing beats a simple line chart for tracking your Customer Churn and MRR Churn month after month. It’s the quickest way to spot trends, notice seasonal dips, and see if that new feature you shipped actually moved the needle.
- Waterfall Charts for MRR Movement: If you want to understand what's really driving your Net Revenue Retention, a waterfall chart is your best friend. It beautifully illustrates your starting MRR, then shows how expansion revenue builds it up while churn and contractions tear it down. You get a crystal-clear picture of your net growth.
- Cohort Grids for Retention Analysis: A color-coded grid, often called a heat map, is hands-down the best way to see cohort retention. It lets you instantly compare different groups of users over time. Are your January signups sticking around longer than your February ones? A cohort grid will tell you at a glance.
This diagram shows how different metrics—like Logo Churn, Cohort Analysis, and LTV—all flow into a central hub of actionable insights that help you fight churn and grow smarter.
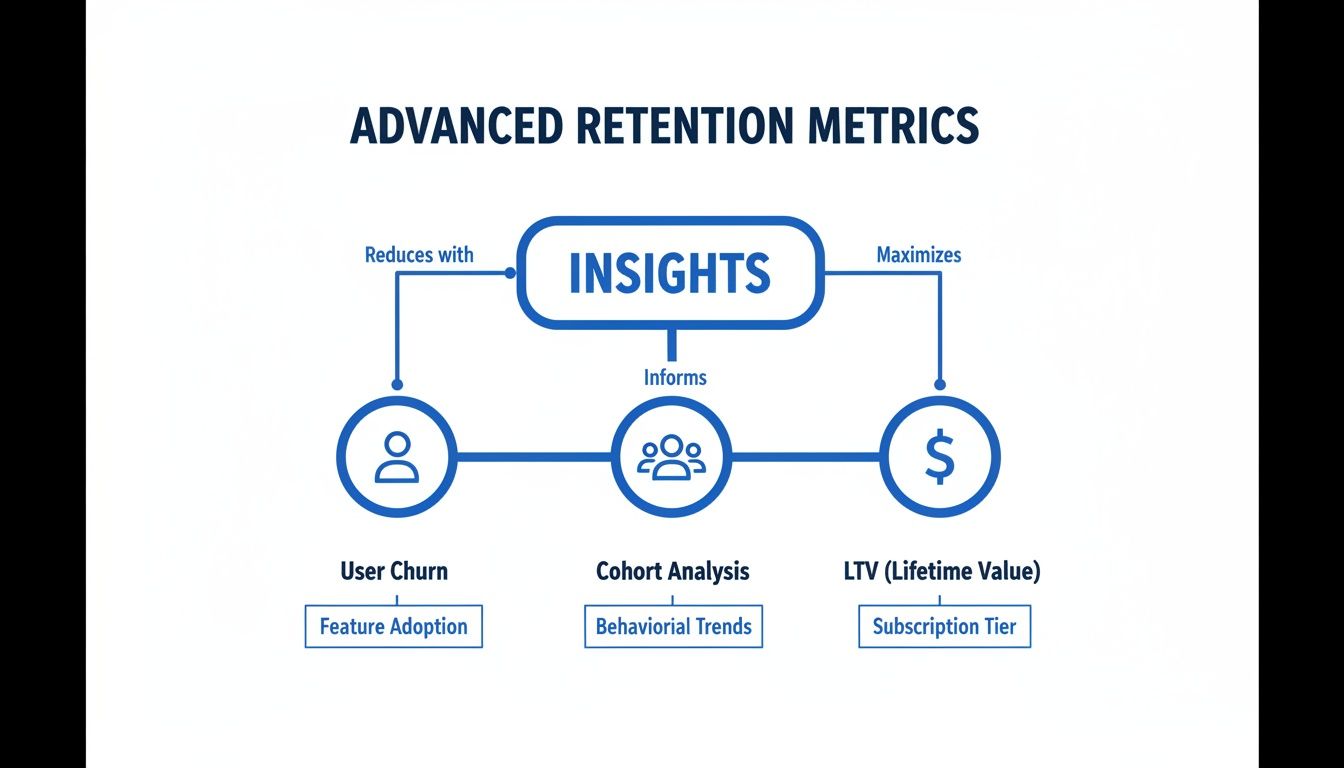
The real takeaway here is that you need a holistic view. Stitching these different data points together is what gives you the context to make truly informed decisions.
From Complex Data to Clear Signals
Let's be honest: building and maintaining these dashboards manually can be a full-time job, especially when you're pulling from constantly-updating Stripe data. This is where dedicated platforms come in. They do the heavy lifting of pulling the data and building the charts so you can skip straight to the important part: taking action.
A tool like LowChurn hooks directly into your Stripe account and spins up these crucial visualizations for you automatically. But it also takes things a step further by turning that raw data into predictive signals, like assigning a dynamic health score to each customer.
For example, this dashboard visualizes customer health scores, giving teams an immediate, color-coded view of which accounts are at risk.
Instead of your team trying to interpret raw numbers, they get a simple, prioritized list of customers who need help right now. It shifts the entire process from reactive fire-fighting to proactive problem-solving.
Key Insight: The point of data visualization isn't just to make pretty charts. It's to simplify complexity and trigger a specific action. A great dashboard should immediately answer the question, "Okay, so what do I do next?"
When you turn your client retention metrics from static figures into dynamic, visual stories, you give everyone in your organization—from customer success to product—the power to make smarter, faster decisions that protect your revenue and fuel real, sustainable growth.
Turning Metrics into Actionable Retention Plays
Knowing your client retention metrics is like reading the scoreboard at a game. It tells you if you're winning or losing, but it doesn't actually tell you how to score the next point. To really cut down on churn, you have to turn those numbers into a game plan—a set of specific, repeatable actions we call "retention plays."
These plays are what bridge the wide gap between seeing data on a dashboard and getting real results. Think of them as your team's go-to strategies for stepping in at just the right moment to save a customer, recover lost revenue, and drive home the value of your product. Instead of just reacting to a cancellation email after the fact, you're getting ahead of the problem and proactively changing the outcome.
The At-Risk Customer Playbook
One of the most valuable signals you can possibly track is a customer's health score, especially when it starts to dip. This score is usually a smart blend of product usage data and their subscription history, flagging accounts that are quietly drifting away. This playbook is your rapid-response plan for pulling them back in before they churn for good.
The trigger is simple: a customer's health score drops into an "at-risk" category. This is a signal that tools like LowChurn can automate for you. As soon as that alert fires, the entire goal is to deliver immediate, personalized value that reminds them why they signed up in the first place.
Here’s how you can run this play:
- Personalized Outreach: Get a customer success manager to send a real, non-automated email. Ditch the generic "just checking in" line. Instead, reference their specific activity: "Hey [Name], I noticed you haven't used [Key Feature] much lately. We just pushed an update that could really help with [Their Goal]. Got 15 minutes to walk through it?"
- Offer Proactive Support: Frame the entire conversation around helping them achieve their goals, not just about keeping their business. This simple shift positions your team as a genuine partner, not just another vendor.
- Provide a Small Win: Guide them to a quick, valuable action inside your product. Helping them solve one small problem can completely rebuild their momentum and refresh their memory of the value they're paying for.
The outcome you're aiming for is a re-engaged customer who feels seen and supported. You haven't just prevented a potential cancellation—you've actually made the relationship stronger by showing you care.
The Failed Payment Playbook
Involuntary churn—the kind that happens from a simple payment failure—can account for a shocking 20-40% of all customer churn. This is often the lowest-hanging fruit for revenue recovery. This playbook uses a smart dunning process (the fancy term for how you communicate about overdue payments) to fix the problem without creating a frustrating customer experience.
The trigger is a failed payment notification from your payment processor, like Stripe. The goal is to make it incredibly easy for the customer to update their card info and keep their subscription going without a hitch.
Here’s a proven sequence that works:
- Day 1: An automated, friendly email goes out immediately. It lets them know about the payment issue and provides a direct, one-click link to update their billing details.
- Day 3: A second, gentle reminder is sent. This one might highlight one or two key features they'll lose access to if the subscription lapses.
- Day 7: A final, more direct notification explains that the account will be suspended if the payment isn't resolved soon.
- Post-Cancellation: A week after a potential cancellation, a "win-back" email is sent, offering a simple way to reactivate their account.
When designing your retention plays, leveraging advanced tools for customer interaction, such as exploring options for AI-powered customer support, can significantly enhance customer satisfaction and loyalty.
The Successful Onboarding Playbook
Let's be clear: the first 30 days of a customer's journey are the most critical. This is the window where they decide if your product is a "must-have" or just a "nice-to-have." This playbook is designed to ensure every new user experiences a key "aha!" moment as quickly as possible, cementing your product's value from day one.
The trigger for this play is simply a new customer sign-up. The primary goal is all about time-to-value—that is, shrinking the time it takes for them to achieve their first meaningful outcome with your product.
Key Insight: Loyalty programs and CRM mastery are retention goldmines, with the global CRM market exploding to $57 billion, fueling strategies that keep subscribers hooked. In SaaS, where onboarding quality is the #1 churn reducer and tiered customer success lifts efficiency by 12-20%, these tactics align perfectly with dynamic health scores and prioritized at-risk lists.
This playbook requires a coordinated effort, blending your product experience with your communication channels:
- Welcome Email Series: Don't just send one welcome email and call it a day. Create a 3-5 part series that methodically guides users through their most important first steps.
- In-App Checklists: Use a simple checklist right inside your product to nudge new users toward key activation milestones, like "Create Your First Project" or "Invite a Teammate."
- Proactive Check-in: At the 14-day mark, automatically trigger a personalized email from a founder or the head of customer success. A simple "how are things going?" and an offer to help can work wonders.
By consistently running these playbooks, you'll transform your client retention metrics from passive numbers on a screen into an active system for protecting your revenue and building a loyal customer base that sticks around for the long haul.
Common Questions About Client Retention Metrics
Once you start digging into client retention metrics, the questions pop up fast. And they should. This isn't just about plugging numbers into a formula; it's about understanding the nuances that can make or break your growth. I've gathered some of the most common questions I hear from SaaS founders and teams to give you clear, straightforward answers.
Think of this as your field guide for bridging the gap between theory and what actually works. Getting these details right is what separates a business that just tracks data from one that uses it to build a retention engine that can't be stopped.
What Is a Good Customer Retention Rate for a SaaS Business?
Everyone’s looking for that one magic number, but the honest answer is: it depends. A "good" rate is always relative to your industry, business model, and average contract value. That said, we can definitely set some solid benchmarks to aim for.
For most SaaS businesses, a Customer Retention Rate (CRR) consistently above 90% is a sign of a healthy, sticky product.
But the real game-changer is Net Revenue Retention (NRR). An NRR over 100% is the gold standard for any subscription company. Why? Because it means your revenue from existing customers is actually growing, even after accounting for churn. Top-tier public SaaS companies often boast an NRR of 120% or higher, which shows you just how powerful expansion revenue from upgrades and add-ons can be.
If you’re a startup and you hit an NRR over 100%, you’ve got a massive signal of strong product-market fit. It proves you have a sustainable model where customers don't just stick around—they grow with you.
How Can I Track Retention Metrics Accurately with Stripe?
Stripe is an amazing payment processor, but it gives you the raw ingredients, not the finished meal. To get from raw subscription data to truly actionable metrics, you need an analytics layer sitting on top of it.
Many founders kick things off with a manual spreadsheet. I've been there. But as you scale, that spreadsheet quickly morphs into a time-sucking, error-prone monster.
Sure, you could go the route of a heavy-duty BI tool, but that often means a significant technical setup and ongoing maintenance. The most direct path for a Stripe-powered business is a tool built specifically for this job.
- Automation is essential: A platform like LowChurn connects directly to your Stripe account in a single click.
- Calculations are done for you: It handles all the complex calculations—CRR, MRR Churn, LTV, NRR—so you can trust the numbers without worrying about a broken formula in cell G42.
- Data becomes insight: It translates everything into an easy-to-read dashboard, turning complex data into clear signals you can act on.
This kind of automation doesn't just save you hundreds of hours; it gives you predictive insights that a spreadsheet could never dream of.
What Is the Difference Between Voluntary and Involuntary Churn?
This distinction is absolutely critical. You fight each type of churn with completely different weapons, so knowing which one you're dealing with helps you focus your efforts where they'll actually make a difference.
Voluntary Churn is exactly what it sounds like—a customer makes a conscious choice to hit the cancel button. This is usually driven by a perceived lack of value, a crummy customer experience, or a competitor swooping in. Tackling this kind of churn means making fundamental improvements to your product, onboarding, and customer support.
Involuntary Churn is the silent killer. It happens when a subscription gets canceled due to a failed payment, often from an expired credit card or insufficient funds. This is almost always unintentional, but it can be responsible for 20-40% of total churn in a SaaS business. Fighting involuntary churn is a technical problem, solved with a smart dunning process that includes automated payment retries and clear notifications to help customers update their billing info.
How Early Can I Predict if a Customer Will Churn?
With the right setup, you can spot the warning signs surprisingly early—long before a customer is even thinking about canceling. Traditional methods rely on lagging indicators, things that only tell you a problem has already happened, like a missed payment or a rage-filled support ticket.
Modern, AI-powered platforms flip the script by focusing on leading indicators. They analyze subtle patterns in behavior that signal risk long before the customer has made up their mind to leave. By combining Stripe data with product usage signals—like a drop in daily logins or a failure to adopt a key feature—these systems can spot trouble brewing on the horizon.
This technology can often predict churn risk with high accuracy 7 to 30 days in advance. That gives your customer success team a crucial window to intervene with a targeted email, a helpful offer, or some proactive support to get them back on track. If you have more questions or seek deeper insights into various aspects of client retention and SaaS growth, additional resources are often available on the BuddyPro.ai blog.
Ready to turn your Stripe data into an early-warning system for churn? LowChurn uses AI to predict which customers are at risk, giving you the insights and playbooks needed to act before it's too late. Start protecting your revenue today.