A customer segmentation model is simply a way to divide your customer base into smaller, more manageable groups. For a SaaS company, this isn't about vague demographics. It’s about digging into actual user behavior—things like which features they use and their subscription history—to get a real sense of which customers are happy and which are quietly heading for the door.
Why Old-School Segmentation Falls Short for SaaS
Let's be blunt: traditional customer segmentation is broken for modern SaaS. For years, businesses leaned on broad, static categories to understand their audience. This approach has its roots in mid-20th-century marketing theory, where the idea of dividing a market was a huge leap forward. A 1956 paper by Wendell R. Smith was a landmark piece that helped establish how grouping customers by shared traits could make product differentiation stick. You can learn more about the origins of segmentation theory and see how these core principles were formed.
But for a subscription business, that's where the history lesson ends.
Relying only on static data—like company size, industry, or where a customer is located—is like trying to drive with a map from last century. It gives you a snapshot of who a customer is, but it tells you absolutely nothing about where they're headed.
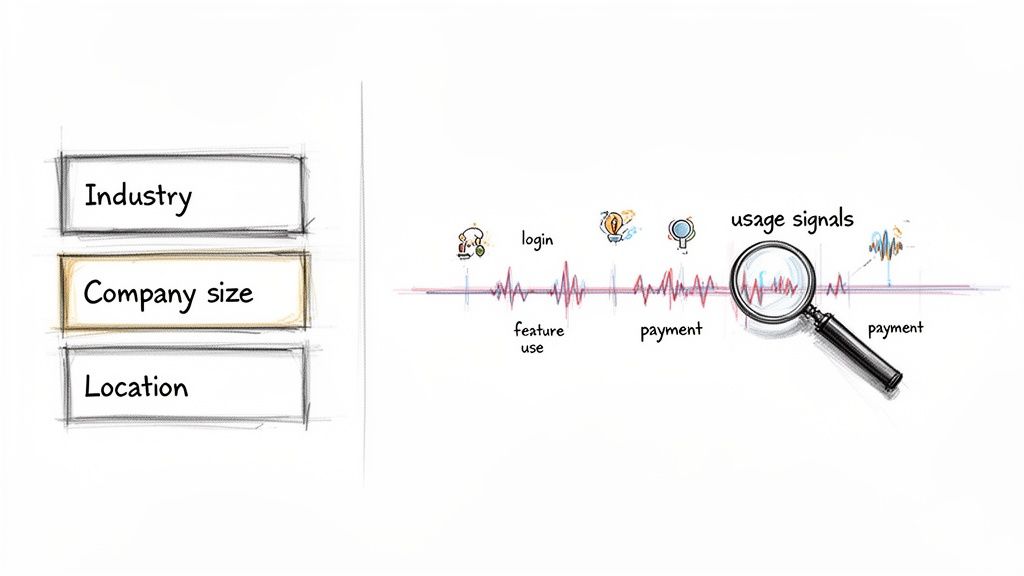
The Limits of Static Data
Static firmographic data completely misses the real story of customer health, which is hidden in their day-to-day actions inside your product. A small startup and a Fortune 500 company might technically be in the same industry, but their product usage—and their risk of churning—could be worlds apart.
These outdated methods just can't answer the questions that keep SaaS founders up at night:
- Which high-value accounts are slowly but surely disengaging?
- Which new sign-ups are hitting a wall with key features and about to give up?
- Who are my power users that are ready for an upsell conversation?
The biggest flaw of old-school segmentation is that it’s purely reactive. By the time you spot trouble using firmographics alone, your customer has already mentally checked out. You're left trying to salvage an account that was sending clear warning signs for months.
Shifting to a Predictive Mindset
The answer is to move from those broad, static buckets to a dynamic, predictive customer segmentation model. This modern approach centers on what your customers do, not just who they are on paper.
By analyzing real-time behavioral signals like feature adoption, login frequency, and even payment history from a source like Stripe, you can build an early warning system. This setup lets you proactively protect your revenue instead of scrambling to fix problems after the damage is done. A behavioral model creates segments based on customer health and engagement, giving you the insight to step in with the right help at exactly the right moment.
What Data Actually Predicts Churn?
A great customer segmentation model isn't built on a mountain of data; it's built on the right data. The good news is, you're probably already sitting on the most predictive information you need. The trick is to combine the financial story with the behavioral one.
You’ll want to pull from two main places: your payment processor (we'll focus on Stripe) and your product analytics. By weaving these together, you get a 360-degree view of customer health that you simply can't get from one source alone. And the best part? It doesn't require a massive engineering lift to get started.
Let's break down exactly what to look for.
Essential Data Sources for Your Churn Model
To build a truly predictive model, you need to connect what customers are paying for with what they're actually doing inside your product. The table below outlines the specific metrics I've found to be most impactful when segmenting customers for churn risk.
| Data Source | Key Metrics to Track | Why It's Predictive |
|---|---|---|
| Stripe | Payment Failures, Plan Downgrades, Pauses/Cancellations | These are direct financial signals. A failed payment or a downgrade is a clear sign a customer is re-evaluating their investment. |
| Product Analytics | Login Frequency, Core Feature Adoption, Workflow Completions | This is your "stickiness" factor. Low engagement with the features that deliver your core value is the classic precursor to churn. |
| Stripe | Trial-to-Paid Conversion Rate | A strong early indicator. If a customer hesitates to convert, it can signal long-term retention issues with that cohort. |
| Product Analytics | Support Tickets & Help Center Usage | Spikes in support tickets can mean frustration. Conversely, zero interaction with help docs might signal apathy. Both are concerning. |
This combination gives you both the "what" (subscription changes) and the "why" (behavioral changes) behind potential churn.
Tapping into Stripe Subscription Data
Think of your payment system as more than just a tool for collecting money—it’s an early warning system. Events happening inside Stripe are often the first hard evidence that a customer relationship is on shaky ground. The focus here is strictly on subscription events and metadata, so you never have to touch sensitive PII or financial details, keeping things low-friction and privacy-conscious.
Here are the signals I always watch:
- Payment Failures: One failed payment is a problem. Two or more in a row? That's a massive red flag.
- Plan Downgrades: When someone moves to a cheaper plan, they're explicitly telling you they see less value in your service. Listen to them.
- Subscription Pauses or Cancellations: These are the most direct signs of churn intent, even if the subscription won't officially end for a few weeks.
- Trial-to-Paid Conversion: This initial moment of commitment is a surprisingly strong predictor of future loyalty. Poor conversion rates often point to deeper issues.
By tracking these events, you capture the moments that matter most. For an even deeper understanding, you can see how cohort analysis works to spot trends in how different customer groups behave over time using this exact data.
Tracking Critical Product Usage Metrics
While Stripe tells you what people pay for, your product analytics tell you what they actually do. This is where you find out if your product has become indispensable. I can't stress this enough: low product engagement is one of the single most reliable predictors of churn.
You don’t need to track every click. Just focus on a few key interactions that prove a customer is getting meaningful value.
The goal isn't to track every single click. It's to identify the core "aha!" moments and workflows that define an active, healthy user. A customer who consistently completes these key actions is far less likely to churn.
Here are the usage metrics I always build a model around:
- Login Frequency: Are they logging in daily? Weekly? A sudden drop-off is a classic sign of disengagement.
- Key Feature Adoption: Identify the 2-3 core features that deliver your main value proposition. Are they being used? A customer who lives in the secondary features might not be getting the full value they're paying for.
- Workflow Completions: Are users actually finishing the primary task your product was built for? If you have a project management tool, this means creating and completing projects, not just logging in.
- Support Tickets or Help Center Usage: A sudden flood of support tickets can signal a frustrated user. On the flip side, a complete lack of engagement with help docs could mean they've just given up.
When you merge these behavioral signals with the subscription events from Stripe, your segmentation model suddenly has the context it needs to tell you not just who is at risk, but why.
Building Your Customer Segmentation Model
Now that you've gathered your high-impact data, it's time to turn those raw signals into an engine that can actually predict churn. This is the leap from just having data points to creating a smart customer segmentation model. The whole process really boils down to two critical phases: first, creating intelligent features from your data, and second, picking the right modeling technique to group your customers in a meaningful way.
The first part, what we call feature engineering, is honestly where most of the magic happens. It’s the art of transforming raw data—like a login date or a subscription amount—into much more powerful predictors. You’re not just looking at isolated events; you're building new metrics that tell a much richer story about a customer's journey and their current health.
This whole flow, from raw data to actionable segments, is what we're aiming for.
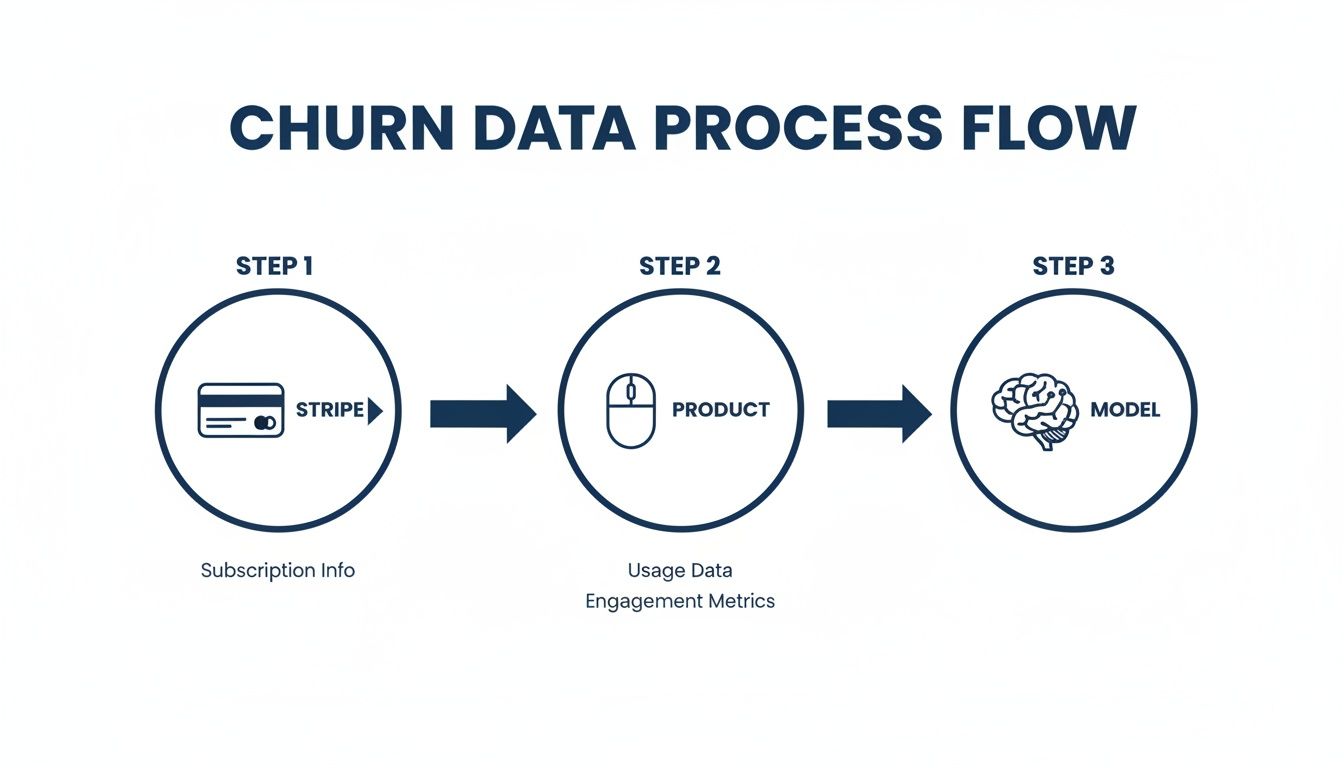
As you can see, you’re taking financial signals from Stripe and behavioral cues from your product, then feeding them into an analytical model to pinpoint where the real churn risks are hiding.
Crafting Predictive Features from Raw Data
On their own, simple metrics don't tell you much. Feature engineering is what adds the necessary context. It involves comparing, combining, and calculating new variables that reveal momentum and intent. It's the difference between knowing a user logged in last Tuesday and knowing their login frequency has plummeted 50% in the past 30 days.
Here are a few powerful features I've seen work wonders:
- Days Since Last Login: A classic for a reason. It’s a direct, effective indicator of disengagement.
- Feature Adoption Velocity: How fast does a new user start using your sticky features? A slow start is a huge red flag.
- Support Ticket Ratio: Don't just count tickets. Calculate the ratio of support tickets to active days. A high ratio screams user frustration.
- Payment Failure Rate: One failed payment might be a fluke. The percentage of failed payments over the last six months? That’s a real financial health signal.
The goal is to create features that capture change over time. A static snapshot is useful, but a trend line is what truly predicts future behavior. This is how your model learns to spot a healthy customer who is starting to drift away.
Once you have a solid set of engineered features, you're ready to pick your modeling approach. Your choice here really depends on your specific goals and the nature of your data.
Choosing Your Modeling Approach
There’s no single "best" model for this. The right choice hinges on whether you want to discover natural, hidden groupings in your customer base or if you want to predict a specific outcome, like churn. The tools we have today have moved this process far beyond static demographics. For instance, Temes Consulting built models for automotive giants like Ford and Toyota by combining financial data with lease expiry dates. This let them pinpoint ideal buyers for personalized campaigns, boosting dealership visits by an incredible 317% in just one year.
For SaaS churn, your main options fall into two camps.
1. Unsupervised Clustering (Finding Natural Groups)
Think of clustering algorithms, like K-Means, as exploratory tools. They sift through all your feature data and automatically group customers into segments based on similarity, without you telling them what to look for. You might uncover segments you never even considered, like "Power Users with Declining Financial Health" or "Low-Usage but Stable Accounts." This is a fantastic place to start if you want to get a real, unbiased lay of the land.
2. Supervised Classification (Predicting Churn Directly)
If your only goal is to predict who will churn, a supervised model is the most direct path. You'll need to label your historical data—customers who churned vs. those who stayed—and then train a model like Logistic Regression or a Gradient Boosting model to spot the patterns that precede a cancellation. The output is a clear churn probability score for every single customer, which makes it incredibly easy to prioritize your outreach.
Often, a hybrid approach works best. You can start with unsupervised clustering to identify interesting segments, and then run a supervised model to calculate a precise churn risk score for each customer within those segments. This gives you both the "who" (the segment) and the "how likely" (the score), creating a powerful one-two punch for your retention strategy.
From Segments to Actionable Retention Plays
Okay, you've built a killer segmentation model. That's a huge step, but the real magic happens when you turn those insights into action. A model that just sits in a dashboard is a missed opportunity. The goal is to create concrete retention strategies that stop churn before it even starts, connecting your data science work directly to the bottom line.
A good model doesn't just hand you a list of at-risk accounts. It gives you the context—the "why" behind their behavior. This is what lets you graduate from generic "we miss you" emails to targeted, high-impact interventions that solve the actual problem a customer is facing.
From Insight to Intervention
First things first, give your segments names that mean something. Ditch generic labels like "Segment A" or "Cluster 2." Think like a marketer and use names that tell a story. This simple change makes the data instantly accessible to everyone on your team, from customer success to product.
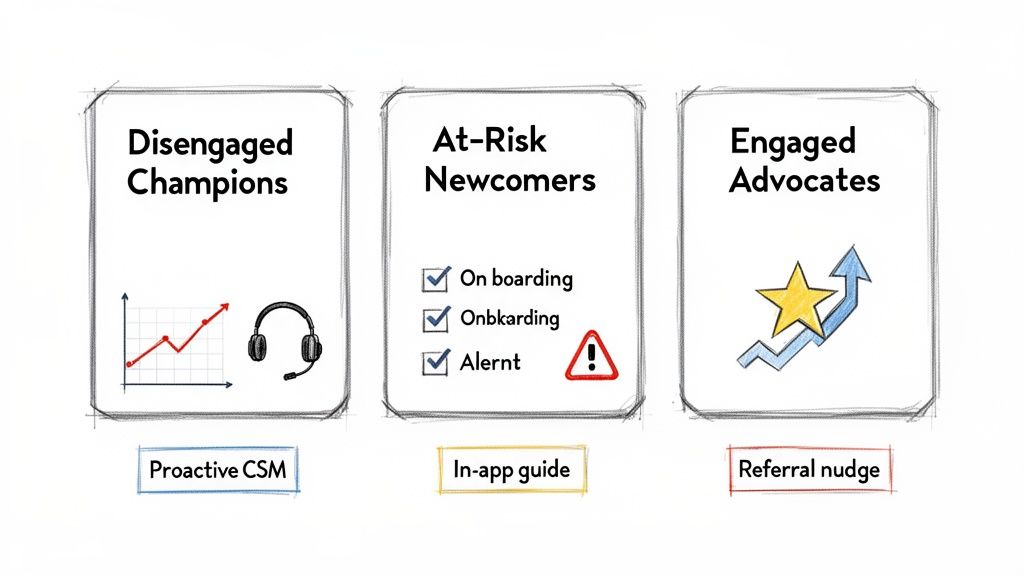
Your model will likely surface a few classic SaaS personas:
- Disengaged Champions: These are your power users—maybe on a high-tier plan—who have suddenly gone quiet. Their usage has fallen off a cliff. Something's up, and you need to find out what.
- At-Risk Newcomers: These folks just signed up but are already drifting. They never finished onboarding or haven't touched a key feature in their first 14 days. They're struggling to find that initial spark of value.
- Engaged Advocates: This is your ideal customer profile. They log in often, use core features, and their payment history is solid. They aren't a churn risk, but they are perfect candidates for a case study or an upsell conversation.
Once your segments are defined, you'll need solid marketing automation best practices to put these insights to work at scale.
Building Your Retention Playbooks
Now, you build a specific, low-effort playbook for each segment. The trick is to match the solution to the problem.
For your At-Risk Newcomers, the problem is all about activation.
- The Play: Don't just email them. Trigger an automated in-app guide that points them directly to the feature they're stuck on. You can follow that up with a simple, personal-feeling email from a founder offering a quick 15-minute onboarding call.
For your Disengaged Champions, the problem is a sudden drop in perceived value.
- The Play: An automated message won't cut it here. These accounts are too valuable. Flag them for a customer success manager to send a personal, one-to-one email. Keep it simple: "Hey [Name], noticed you haven't been using [Feature X] as much. Is everything okay? Any feedback for us?"
Visualizing this data is key to helping your team prioritize where to spend their time.
A dashboard like this turns your model's output into a daily to-do list for your customer-facing teams, showing them exactly who needs attention and why.
The best playbooks are proactive, not reactive. You aren't just trying to win back someone who is about to cancel. You're intervening so early that the thought of canceling never even crosses their mind.
This is how your customer segmentation model evolves from a static report into a dynamic engine that actively protects your revenue. These segments are also foundational inputs for building a comprehensive customer health score, which we cover in another guide.
Bringing Your Churn Model to Life
A predictive model sitting on a server is just a clever experiment. It doesn't save a single dollar of MRR until it’s actually put to work. This final phase is all about getting your customer segmentation model into the hands of your team so they can act on fresh, accurate data every single day.
The very first thing you need to do is make sure the model actually works. Before you build entire retention workflows around its predictions, you have to trust them. The best way to do this is through backtesting.
Validating with Historical Data
Think of backtesting as a time machine for your data. You feed the model customer data from, say, six months ago and see if it would have correctly flagged the accounts that actually ended up churning in the following month.
Did the model catch your biggest churn events before they happened? This process is all about building confidence and fine-tuning the model's sensitivity. If it missed major cancellations, it’s a clear sign you need to go back to the drawing board—maybe revisit your feature engineering or tweak the model's parameters.
A model that can’t accurately predict the past is unlikely to predict the future. Backtesting isn’t just a nice-to-have; it’s a critical step to ensure your churn alerts are based on a solid, reliable foundation.
Monitoring and Adapting Over Time
Once your model is live, the job isn’t done. Far from it. Customer behavior is always in flux. Your product evolves, market dynamics shift, and a model trained on last year's data will inevitably lose its edge as new usage patterns emerge. This is why continuous monitoring is so crucial.
Your team needs a way to track the model's performance over time. Are its predictions still holding up a quarter after launch? As detailed in this guide on AI observability, you need systems in place to monitor and manage its performance to maintain trust in its outputs.
Ultimately, you want to operationalize these insights. This means getting out of static spreadsheets and integrating the model's output directly into a live dashboard. This system should give you:
- Dynamic Customer Health Scores: A real-time score for every customer, updated daily.
- Prioritized Watchlists: A clear, automated list of at-risk accounts for your success team to jump on.
This is how you turn a data science project into a proactive engine for revenue retention. To see exactly how this works in practice, check out our detailed guide on building a churn prediction model from the ground up.
Common Questions About Building a Churn Model
Even with a solid plan, a few practical questions always pop up when it's time to build a customer segmentation model. I see founders and their teams get stuck on the same handful of "what ifs" and potential roadblocks. Let's tackle those common hurdles head-on so you can move forward with confidence instead of getting stuck in analysis paralysis.
Here are the answers to the questions I hear most often from SaaS teams who are just diving in.
How Much Data Do I Really Need?
You almost certainly have enough data to get started right now. There's a common misconception that you need a massive, "big data" level dataset to do anything useful, but that’s just not true. For most SaaS businesses, having 3-6 months of solid subscription and product usage data is plenty to start spotting real churn patterns.
Honestly, it's about quality over quantity. I've seen teams pull powerful insights from a dataset with just a few hundred customers because they were tracking the right behavioral events. The goal isn't just to have a mountain of records; it's to observe how customer behavior changes over time. That's where the magic is.
What Are the Biggest Mistakes People Make When Segmenting for Churn?
The most common trap is leaning too heavily on static, firmographic data. Things like company size or industry are surprisingly bad at predicting churn, especially in a world where product usage is king. Another classic mistake? Creating way too many segments. It just adds a ton of complexity without creating any real value, and your team won't know what to do with them.
Start simple. You only need a few clear, actionable groups—no more than 3-5 to begin with. Think in terms of labels like ‘Engaged,’ ‘At-Risk,’ and ‘Power Users.’ That’s a hundred times more useful than a dozen confusing, hyper-specific segments.
And finally, please don't let your model become a "set it and forget it" project. If your model isn't plugged into your team's daily workflow, it's nothing more than a cool science experiment. It has to be a living, breathing tool that helps your team make proactive decisions every single day.
Can I Actually Do This Without a Data Science Team?
Absolutely. The barrier to entry has never been lower. While building a fully custom model from scratch in-house does require some serious stats and engineering know-how, modern tools have put this kind of powerful analysis within reach for just about everyone.
There are now platforms designed specifically to solve this exact problem for SaaS companies. No-code tools can plug directly into your data sources like Stripe, handle all the messy feature engineering and modeling behind the scenes, and feed you real-time churn alerts and customer health scores. You get all the benefits of a sophisticated customer segmentation model without needing to hire a dedicated data scientist.
Ready to stop guessing and start predicting? LowChurn connects to your Stripe account in one click and uses AI to identify at-risk customers 7-30 days before they cancel. See your churn risk in real-time and start saving MRR this week. Get your free churn analysis.