At its core, a churn prediction model is a system that looks at all your customer data and tries to figure out who's most likely to cancel their subscription. Think of it as an early-warning system for your revenue. Instead of being surprised by a cancellation email, you get a heads-up, giving you a chance to step in and help.
This isn't just a minor tweak to your workflow; it fundamentally changes how you approach customer retention.
Moving From Reactive to Proactive Retention
For a long time, most SaaS companies have been stuck in a reactive loop. A customer cancels, an alert goes off, and maybe an automated "we're sorry to see you go" email gets sent out. That’s like trying to fix a leak after the ship has already taken on water—the damage is done, and the revenue is gone.
A churn prediction model flips this entire script. It shifts your focus from the rearview mirror (analyzing why people left) to the windshield (seeing the risks up ahead). The central question changes from "Why did they cancel?" to "Who looks like they might cancel, and how can we convince them to stay?"
This proactive approach turns retention from a backward-looking metric into a forward-looking strategy, empowering your teams to act when it actually counts.
Let's break down the difference in approach.
Reactive vs Proactive Churn Management
| Attribute | Reactive Approach (Without Model) | Proactive Approach (With Model) |
|---|---|---|
| Timing | After the customer has already canceled. | Before the customer decides to leave. |
| Focus | Analyzing past churn events. | Forecasting future churn risk. |
| Action | Sending exit surveys or "win-back" offers. | Offering targeted help, training, or incentives. |
| Data Usage | Historical reports (lagging indicators). | Real-time signals and predictive scores (leading indicators). |
| Team Mindset | Damage control and post-mortems. | Opportunity-focused and preventative. |
| Outcome | High cost to re-acquire; often too late. | Increased retention and customer lifetime value. |
As the table shows, a predictive model doesn't just give you data; it gives you the runway to actually use that data effectively.
How a Churn Model Actually Works
So, what’s happening under the hood? A churn prediction model is constantly sifting through mountains of data, searching for the subtle patterns that show up before a customer cancels. It connects dots that are almost impossible for a person to see on their own.
It's looking for signals across different parts of your business, like:
- Product Usage: Has a user’s login frequency dropped off a cliff? Are they suddenly ignoring a key feature they used to rely on every day?
- Subscription Events: Have there been recent failed payments or downgrades? Is their credit card about to expire next month?
- Behavioral Trends: Is a whole team’s engagement slowly fading, even if one or two power users are still active?
By weighing all these factors, the model generates a "churn risk score" for every single customer. This isn't just a random guess. It's a calculated probability, giving your team a clear, prioritized list of accounts that need attention right now.
A churn prediction model is a powerful application of predictive analytics in marketing, using your own historical data to see what’s coming next. It takes the guesswork out of retention and replaces it with a data-driven strategy.
The Real-World Business Value
The "why" behind all of this comes down to simple, powerful economics. The ROI from a good churn model can be massive because it dramatically cuts down on acquisition costs. After all, it's 5-25 times cheaper to keep a customer you already have than it is to go out and find a new one.
In the SaaS world, where a typical company loses 4-8% of its MRR to churn every single month, this is a game-changer. Predictive models give you a 7-30 day forecast, turning a lagging indicator into a powerful heads-up. This allows you to launch one-click campaigns that recover revenue before it ever walks out the door.
Ultimately, a churn prediction model becomes a strategic engine for real, sustainable growth. It protects your hard-earned Monthly Recurring Revenue (MRR), boosts Customer Lifetime Value (CLV), and gives your product team priceless feedback on what actually keeps people hooked. It’s more than just an algorithm; it’s an early-warning system for your entire business.
The Two Main Flavors of Churn Prediction Models
When you start digging into churn prediction, you quickly realize not all models are built to answer the same question. It's a bit like getting a weather forecast. One app might give you a simple "yes" or "no" on rain for tomorrow, while another shows you a detailed hour-by-hour probability. Churn models work in a similar way, and they generally fall into two main camps.
Each one gives you a different angle on customer risk. Picking the right one really boils down to what kind of answers your business needs to actually do something about churn.
Classification Models: The Simple "Yes" or "No"
The most common starting point for churn prediction is a classification model. Its job is pretty straightforward: it looks at a customer and sorts them into one of two buckets—"likely to churn" or "not likely to churn"—within a set window of time, like the next 30 days.
It’s a binary call. Think of it as a bouncer at a club, quickly deciding who gets a red flag for a closer look and who's good to go.
The most popular algorithms for this kind of task are:
- Logistic Regression: This is often the first model people build. It's fast, the results are easy to understand, and it gives you a clean probability score. It's fantastic for quickly seeing which factors are the biggest drivers of churn.
- Random Forests: This approach is more robust. It builds a whole committee of individual "decision trees" and then takes a vote to make a final prediction. This makes it much less likely to be thrown off by random noise in your data.
- Gradient Boosting Machines (GBM): These are the heavy hitters. They build trees one after another, where each new tree learns from the mistakes of the one before it. In the real world, they often squeeze out the best performance.
Here's a key thing to remember: enterprise SaaS churn is often under 25% a year. A lazy model that just predicts "no one ever churns" would still be 75% accurate on paper! That’s why we lean on metrics like precision and recall. This is where something like a Gradient Boosting Machine really shines, as it can pick up on the complex, subtle signals in user behavior that often precede a cancellation.
This simple decision tree shows how this all comes together in a proactive retention strategy.
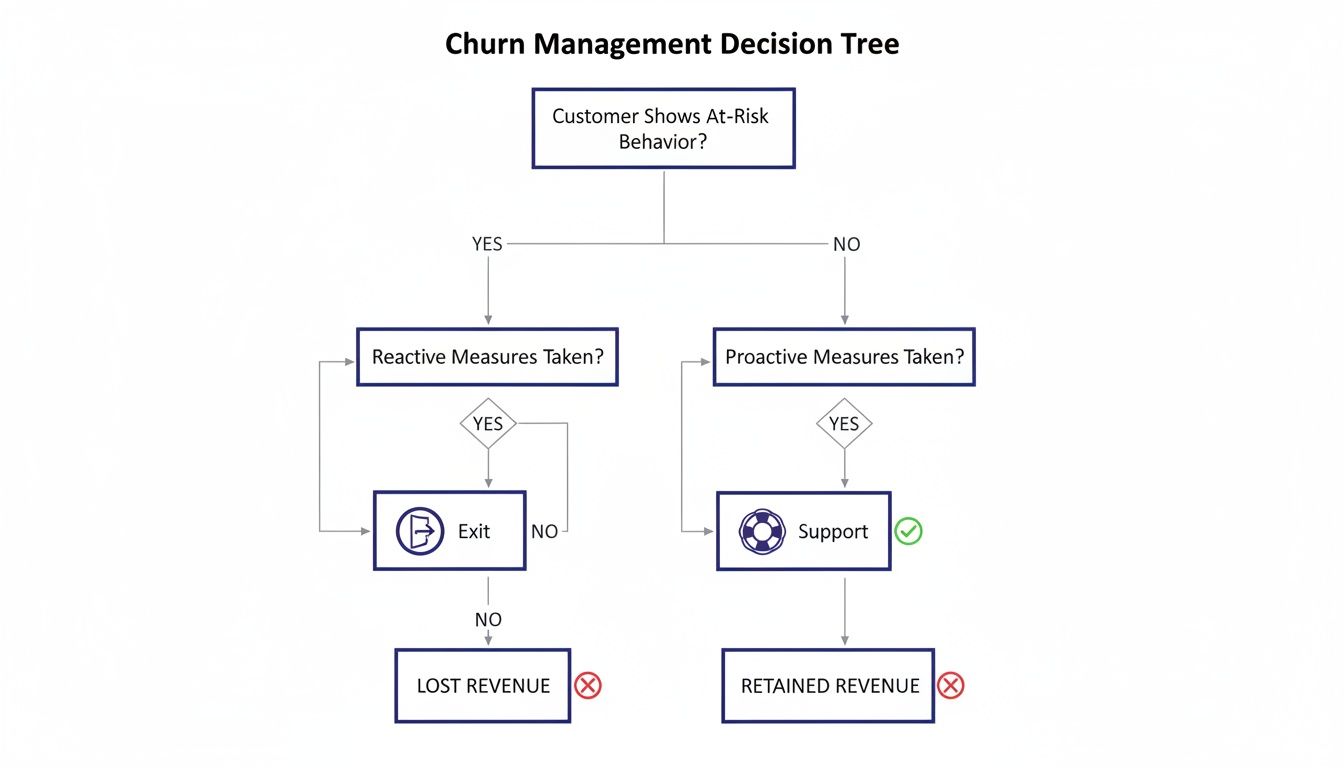
As you can see, the path is clear: proactive intervention leads to retained revenue, while just reacting after the fact leads to lost revenue. It’s a stark difference.
Survival Analysis Models: Getting to the "When" and "Why"
While a classification model tells you if a customer is a risk, survival analysis goes deeper to predict when they are most likely to churn. This technique was originally borrowed from medical research, where it’s used to estimate things like a patient's life expectancy or how long until a disease might come back.
In the world of SaaS, survival analysis forecasts a customer's "lifespan" with your product. It doesn't just give you a static risk score; it provides a risk timeline, pinpointing the most dangerous drop-off points in their journey.
This is a game-changer. Instead of one big "at-risk" list, you can now see which customers are in danger of churning in the next week versus the next quarter. This lets you run much smarter, better-timed retention campaigns. For a deeper look at how this works, check out our guide on predictive analytics for customer retention.
Which Churn Prediction Model Is Right for You?
So, which one should you choose? It really depends on your team's goals and what you're ready to act on.
| Model Type | Best For | Key Question It Answers |
|---|---|---|
| Classification | Creating a clear, prioritized list of at-risk customers who need immediate attention. | "Who is most likely to churn in the next 30 days?" |
| Survival Analysis | Deeply understanding the customer lifecycle and timing your interventions for maximum impact. | "When are my customers most likely to churn and why?" |
The reality is, many modern tools like LowChurn actually use a hybrid model. They blend the straightforward clarity of classification ("who's at risk now") with the forward-looking insights of survival analysis ("who's at risk next"). This gives you the best of both worlds: a prioritized list for today and an early-warning system for tomorrow.
What Data and Features Actually Fuel a Churn Model?
A churn prediction model is only as good as the data you feed it. Think of it like a high-performance engine—its power and reliability come directly from the quality of its fuel. The old saying "garbage in, garbage out" has never been more true. To get a clear signal on which customers are at risk, you need a steady diet of clean, relevant data that tells the whole story.
For most SaaS companies, especially those using Stripe, this "fuel" comes from two critical sources. When you put them together, you get a powerful, multi-dimensional view of customer health and their likely next move.
H3: The Two Sides of the Story: Product Usage and Subscription Signals
The sharpest churn models don't just look at one part of the customer journey. Instead, they blend signals from how a customer uses your product with how they manage their subscription.
Product Usage Signals are all about engagement. These are the digital breadcrumbs customers leave behind as they interact with your app. They tell you if a customer is getting real value or just going through the motions.
On the other side, Subscription Signals from Stripe give you the hard financial and administrative truth. These events are tied directly to revenue and often represent the last few steps a customer takes before they officially churn.
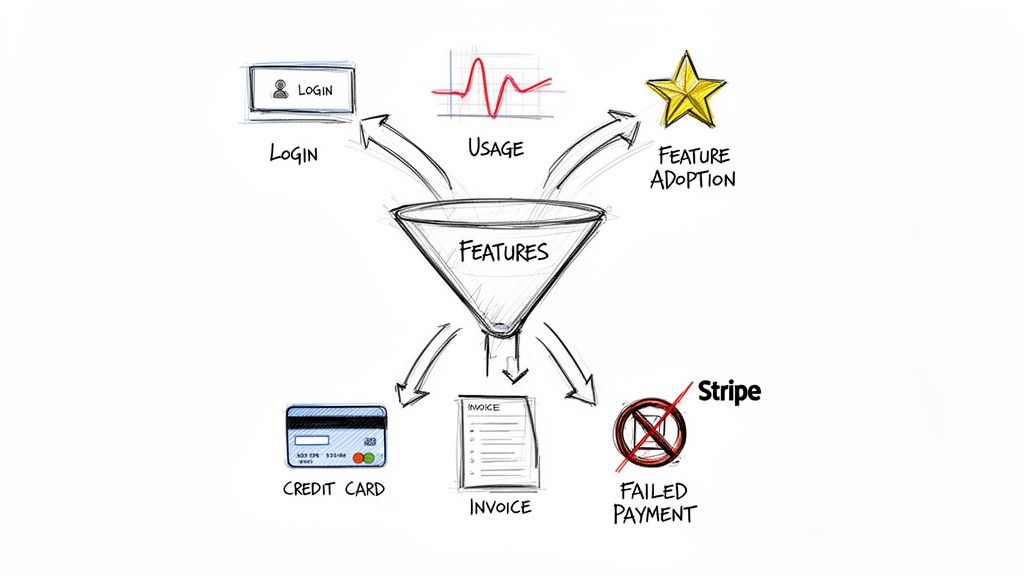
Here's a look at the most impactful data points from both categories that feed a robust churn prediction model.
Key Data Features for Churn Prediction
| Data Category | Example Features | Why It Matters |
|---|---|---|
| Product Engagement | Login frequency, session duration, key feature adoption rate, number of active users per account, support ticket volume. | These metrics show whether a customer is actively deriving value from your product. A sudden drop in usage is a classic red flag. |
| Subscription Activity | Failed payments, plan downgrades, subscription pauses, trial-to-paid conversion rates. | These are direct indicators of financial health and commitment. A customer who downgrades is signaling they're re-evaluating their spend. |
| Customer Profile | Customer lifetime value (LTV), subscription tenure, plan type (e.g., monthly vs. annual), account creation date. | This context helps segment customers. An annual enterprise customer has a different risk profile than a new monthly self-serve user. |
| Timing & Trends | Days since last login, change in usage over the last 30 days, time until next renewal, card expiration warnings. | It's not just what happens, but when. Recent changes and upcoming deadlines are powerful predictors of imminent churn. |
By merging these two streams, you create a complete picture. A slow decline in product usage followed by a failed payment is a much stronger and more urgent churn signal than either event would be on its own.
H3: The Art of Feature Engineering
Of course, raw data isn't quite enough. You have to transform those raw numbers into something meaningful for your model. That process is called feature engineering, and it’s part science, part art. Think of it like a chef taking raw ingredients and turning them into a sophisticated dish.
Feature engineering is where you translate raw data into business wisdom. It’s about asking the right questions, like "How has this user's login frequency changed over the past 30 days compared to the 30 days before that?"
For example, instead of just feeding the model a "last login date," you can engineer a more insightful feature like "days since last active session." That one change turns a static piece of data into a dynamic indicator of disengagement.
To get feature engineering right, you need a solid foundation. That's why knowing how to improve data quality is non-negotiable for building a model you can actually trust.
H3: Prediction Without Sacrificing Privacy
A lot of teams hesitate here, worried that building a churn model means exposing sensitive customer data. That's a common myth. Modern, privacy-first tools can deliver incredibly accurate predictions using only subscription metadata and anonymized usage patterns.
For instance, solutions like LowChurn connect to your Stripe account with a read-only key, so they never touch sensitive financial details or Personally Identifiable Information (PII). By focusing on subscription statuses, plan details, and high-level product events, these systems can build a powerful churn prediction model without ever compromising customer privacy.
These inputs are often more than enough to create a detailed risk profile for every customer. You can learn more about how these signals come together in our guide to building a customer health score.
How to Measure Success Beyond Basic Accuracy
When you're looking at a churn prediction model, it's so easy to get hung up on one number: accuracy. A 95% accuracy score sounds incredible, doesn't it? The problem is, this metric can be wildly misleading, especially for SaaS businesses where churn is, thankfully, a relatively rare event.
Think about it. If you have 1,000 customers and only 20 churn this month, a lazy model that just predicts "no one will churn" would be 98% accurate (980 out of 1,000). On paper, it looks brilliant. In reality, it's completely useless—it didn't help you spot a single at-risk customer.
This is exactly why we have to look past simple accuracy. We need metrics that measure a model's real predictive muscle and its actual value to the business. It’s like a smoke detector: you'd rather have a few false alarms than have it fail to go off during a real fire.
Measuring Overall Predictive Power with AUC
One of the most solid metrics for this job is the Area Under the Curve (AUC). Without diving too deep into the math, AUC tells you how well a model can distinguish between customers who are going to churn and those who are going to stick around.
It essentially answers this question: If you randomly pick one customer who will churn and one who won't, what's the probability that the model gives the churner a higher risk score?
- An AUC of 1.0 is a perfect model. It gets every single prediction right.
- An AUC of 0.5 is no better than flipping a coin.
- A good churn model usually lands at an AUC of 0.85 or higher, which tells you it has strong predictive chops.
This single score gives you a reliable benchmark to compare different models and understand how effective they really are.
Focusing on Action with Precision@k
While AUC is great for a high-level report card, your customer success team needs something they can actually use: a prioritized, trustworthy list of at-risk customers. This is where Precision@k shines.
This metric cuts right to the chase by evaluating the quality of the top k predictions. For example, Precision@100 asks a very practical question: "Of the top 100 customers our model flagged as highest risk, how many actually churned?"
Precision@k is the ultimate test of business utility. It directly measures whether the customers your team spends time trying to save are genuinely the ones most likely to leave, ensuring your retention efforts are focused where they matter most.
In the world of SaaS, this focus is everything. The right models can be genuine game-changers. One team actually achieved an astonishing 96% accuracy rate in pinpointing at-risk customers by digging into historical data to find non-obvious triggers—and they discovered user activity wasn't even a primary driver, turning conventional wisdom on its head. You can read the full analysis on building a game-changing churn model to see how they pulled it off.
Ensuring Trustworthy Probabilities with Calibration
Finally, it’s not enough for a model to just rank customers correctly. The risk scores themselves need to mean something. This is where calibration comes in. A well-calibrated model produces probabilities you can actually trust.
Here's what that looks like: If your model flags a group of 100 customers with a 70% churn risk, a perfectly calibrated model means that, on average, about 70 of them will actually churn. An uncalibrated model might be overconfident, predicting a 70% risk when the true danger is closer to 40%.
This is vital for deciding how to act. Trustworthy probabilities let you segment your outreach intelligently. Maybe you assign high-touch, personal calls for customers with an 80%+ risk score, while using automated re-engagement campaigns for those in the 50-60% range.
Turning Predictions into Action to Save Revenue
An accurate churn prediction model is a fantastic diagnostic tool, but on its own, it doesn't save a single customer. It's only half the battle. Think of it like a weather forecast—knowing it's going to rain is useless if you don't actually bring an umbrella. A list of at-risk customers provides zero business value unless you have a plan to act on it.
This is where the real magic happens. The goal is to connect those predictive insights to a clear, repeatable plan for intervention. It’s about moving from simply identifying risk to proactively preventing churn.
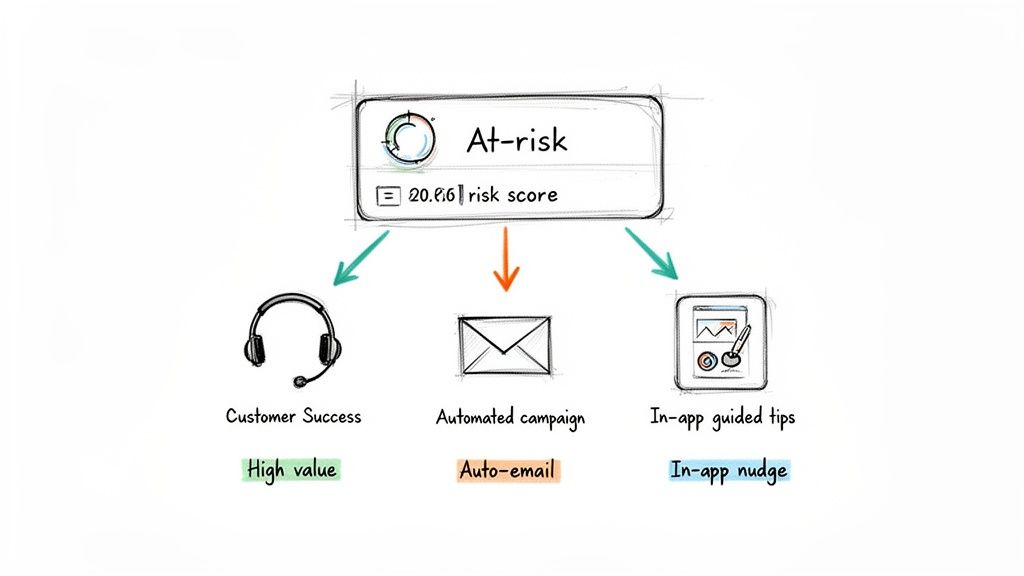
As you can see, a single risk score can trigger a coordinated response across different teams and channels, all working together to keep that customer.
Building Your Retention Playbooks
Here’s a critical piece of advice: don't treat all at-risk users the same. An enterprise account with a 90% churn risk requires a very different approach than a self-serve user on a monthly plan with a 65% risk. Segmentation is the key to making your interventions both cost-effective and genuinely helpful.
By sorting at-risk users into meaningful categories, you can deploy the right action at the right time. This maximizes your team's efficiency and, more importantly, the odds of actually saving the account. A solid set of playbooks means that every churn alert has a clear next step, removing the guesswork and enabling your team to respond fast.
Here are a few practical playbooks you can build around churn risk scores:
- High-Touch for High-Value: When a top-tier customer’s churn score spikes, it should trigger an immediate, personal call or email from their customer success manager (CSM). This isn't a sales pitch. It's a genuine check-in to understand their roadblocks and offer real help.
- Automated Nurturing for the Mid-Tier: For customers in the middle—valuable but not quite enterprise-level—automated email campaigns work wonders. You can send them helpful resources, highlight features they aren't using, or invite them to a training webinar to guide them back to value.
- In-App Guidance for Low Engagement: If a high churn score is tied to poor product usage, your best bet is targeted in-app messages. Use tooltips, walkthroughs, or modals to point disengaged users toward those "aha!" moments they may have missed.
The core principle is simple: match the cost and intensity of your intervention to the value and risk level of the customer. This ensures your most valuable accounts get the white-glove treatment while still efficiently managing risk across your entire user base.
Closing the Loop from Data to Dollars
Historically, one of the biggest hurdles has been the gap between the data science team building the model and the customer-facing teams who need to act on its insights. A churn score buried in a BI dashboard is an insight that dies on the vine.
Modern tools are built to solve exactly this problem. Platforms like LowChurn don't just spit out a list of at-risk accounts; they plug directly into your daily workflow, making it easy to activate these retention playbooks.
This kind of integrated view lets your team see who is at risk, understand why, and immediately know what to do next.
This seamless connection is what turns a churn prediction model from a passive analytical tool into an active, revenue-saving engine. It gives your entire team the power to act decisively on data, ensuring those valuable predictions are translated directly into dollars saved. For a more detailed breakdown of these strategies, you can read our guide on how to reduce customer churn.
Deploying Your Churn Model with a No-Code Solution
Building a custom churn prediction model from the ground up is a monumental project. It’s not just about picking an algorithm; it's about architecting and maintaining an entire data ecosystem. Frankly, this DIY path demands a level of resources—time, money, and people—that most fast-moving SaaS teams just don't have.
Think about it. You need data scientists and engineers to build pipelines, wrangle historical data, train and test different models, and then actually get the best one into production. But the work doesn't stop after launch. Models need constant monitoring and retraining to stay sharp as your product and customers change. This whole process can easily soak up 6-12 months and cost a small fortune before you see a single dollar of ROI.
The No-Code Alternative
For SaaS companies using Stripe, there's a much smarter, faster way to get predictive insights. No-code platforms offer a ready-to-go solution that completely sidesteps the heavy technical lifting. This makes powerful analytics a real possibility for founders and smaller teams who don't have a data science department on payroll.
Instead of a year-long slog, you can have a sophisticated churn model humming along in minutes. These tools are built specifically to plug into your existing stack, turning your complex data into a clear, actionable dashboard almost instantly. The entire point is to deliver value from day one, not a year from now.
This approach is a game-changer. It puts sophisticated modeling techniques, once reserved for huge enterprises with deep pockets, into the hands of any team that wants to be proactive about retention.
How It Works: A Simple Three-Step Process
The real beauty of a no-code solution is its simplicity and speed. A platform like LowChurn is designed so you can get everything set up in under a minute. You connect your data and activate your model without writing a single line of code.
Here’s just how simple it is:
Connect Stripe with One Click: You securely link your Stripe account using a read-only key. The system immediately starts analyzing subscription metadata—things like plan changes, payment history, and lifecycle events—without ever touching sensitive financial data or PII.
Add a Lightweight Snippet: You drop a small JavaScript snippet into your app. This snippet gathers anonymized product usage signals, like how often users log in or interact with key features, giving the model crucial context on engagement.
Get Your First Predictions: The model gets to work right away. As it crunches your historical data and tracks new activity, it starts generating reliable churn risk scores for every single customer. Within a few days, your dashboard will light up with a prioritized list of at-risk accounts.
This streamlined process makes getting a churn prediction model incredibly efficient. It removes the technical roadblocks, letting you focus on what really matters: using the insights to have better conversations with your customers and stop revenue from walking out the door. You get the power of a dedicated data science team, delivered as a simple tool that pays for itself in weeks, not years.
Frequently Asked Questions About Churn Prediction
Getting started with churn prediction always brings up a few practical questions. Let's walk through some of the most common ones we hear from SaaS teams.
How Long Until a Churn Model Is Actually Accurate?
This really comes down to how much historical data you have. Once you connect your data, the machine learning process kicks off immediately.
For a SaaS business with a solid 3-6 months of subscription history, a model can start making genuinely useful predictions—often hitting over 85% accuracy—within a couple of days. From there, it only gets smarter. The model continuously learns from new customer behavior, refining its predictions over time.
Can a Churn Model Predict Involuntary Churn, Too?
Yes, it absolutely can. While most people think of churn models for predicting voluntary churn (when a customer decides to leave), a good model will also catch the signals for involuntary churn.
By digging into your Stripe data, a model can spot patterns like repeated payment failures, soon-to-expire credit cards, and dunning notices. This surfaces customers who are at high risk of churning simply due to billing problems, giving you a chance to step in with a dunning campaign and save the account.
What's the Single Biggest Mistake Companies Make with Churn Models?
This one is easy: building a beautiful, accurate model and then doing absolutely nothing with the results. An amazing prediction that just sits on a dashboard is worthless. It's an interesting piece of data, but it doesn't impact your bottom line.
The teams that really succeed with churn prediction don't fall into this trap. They build the model's output directly into how they work.
Here’s what that looks like in practice:
- Arm your teams: Customer success, marketing, and product get clear, prioritized lists of who is at risk and why.
- Have a game plan: They have retention playbooks ready to go the instant a customer gets flagged.
- Act on the data: The goal is always intervention, not just identification.
When you close the loop between knowing who might churn and actually doing something about it, your model transforms from a passive report into an active engine that saves revenue.
Stop guessing which customers might leave. LowChurn gives you a clear, prioritized list of at--risk accounts 7-30 days in advance, so you can intervene and protect your MRR. Get started for free and see your first predictions in minutes.