Every SaaS founder knows that not all customers are created equal. But traditional segmentation based on company size or industry often misses the most critical signal: customer behavior. The difference between a thriving account and a churn risk isn't just their firmographics; it's how they use your product, when they engage, and what value they derive from it. This is why effective customer segmentation is a cornerstone of retention strategy.
This article dives into 10 practical examples of customer segmentation tailored for modern subscription businesses running on Stripe. We'll move beyond the basics to explore actionable models that directly predict and prevent churn. While understanding user motivations through concepts like psychographic segmentation is crucial for a complete picture, our focus here is on the tangible data you can act on immediately.
We will provide the specific signals to track, sample thresholds for creating segments, and real-world business use-cases for each model. More importantly, you'll get actionable retention playbooks you can implement today, especially with tools designed to connect product usage with subscription health. Forget surface-level descriptions; this guide provides a strategic breakdown for each segmentation example, showing you exactly how to turn raw customer data into reduced churn and increased net revenue retention. This is your blueprint for building a smarter, more proactive customer success engine.
1. Behavioral Segmentation by Product Usage Patterns
Behavioral segmentation moves beyond who customers are and focuses on what they do within your product. This is one of the most powerful examples of customer segmentation for SaaS businesses because usage is a direct predictor of retention and churn. It involves tracking feature adoption, login frequency, session duration, and the completion of key workflows.
Unlike static demographic data, behavioral signals provide a dynamic view of customer health. By analyzing how users interact with your platform, you can identify patterns that correlate with long-term value and those that signal churn risk.
Strategic Analysis & Actionable Insights
This method is crucial because it helps you distinguish between paying customers who get value and those who are on the verge of canceling. A customer might be on an annual plan but haven't logged in for 60 days, a clear red flag that demographic data would miss.
Key Insight: For subscription businesses, low product usage is a leading indicator of churn. A customer who isn't actively using your product is unlikely to renew. Tools like LowChurn excel here by combining Stripe billing events with real-time product usage data to create a predictive health score.
Practical Application & Use Cases
Here’s how to apply this segmentation method:
Signals to Track:
- Login Frequency: Daily, weekly, or monthly active users.
- Feature Adoption: Which core features have they adopted? Are they using "sticky" features?
- Key Actions: How many reports have they generated? How many projects have they created?
- Usage Velocity: Is their activity increasing or suddenly dropping?
Example Thresholds:
- Engaged: Logs in 5+ times per week, uses 3+ core features.
- At-Risk: Login frequency dropped by 50% in the last 30 days.
- Inactive: No login or key actions in the past 21 days.
Retention Playbook:
- Target the At-Risk segment with a re-engagement email campaign highlighting a feature they haven't used yet.
- For Inactive users, trigger an automated in-app message or a customer success check-in to understand their roadblocks.
2. Churn Risk Segmentation by Health Score
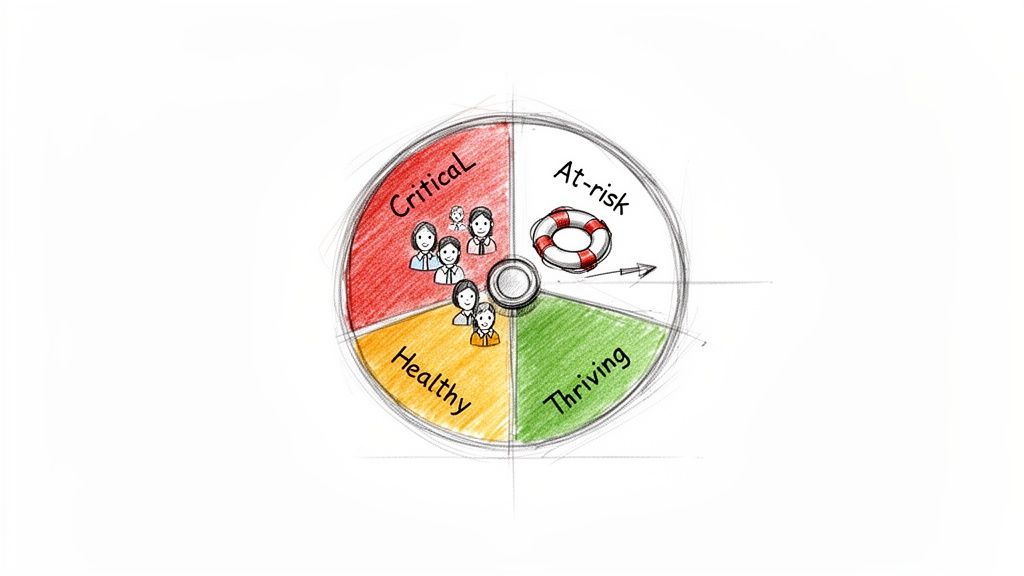
Churn risk segmentation by health score is a method that synthesizes multiple data points into a single, dynamic metric (typically 0–100) to predict customer loyalty. It moves beyond single signals like usage by combining factors like feature adoption, support ticket volume, subscription tenure, and payment history into one actionable score. This provides an immediate, at-a-glance understanding of customer health.
For SaaS retention teams, this is a foundational operational framework. A customer's health score dictates the level and type of intervention needed, allowing teams to prioritize their efforts effectively. Instead of guessing who might churn, you have a data-backed indicator guiding your retention strategy.
Strategic Analysis & Actionable Insights
This approach is powerful because it's predictive, not just reactive. It allows you to identify leading indicators of churn long before a customer stops logging in or their subscription fails. By quantifying customer health, you can operationalize retention efforts at scale, ensuring no at-risk account goes unnoticed.
Key Insight: A customer health score is the most efficient way for Customer Success teams to prioritize their time. Tools like LowChurn are purpose-built for this, creating real-time scores that automatically segment customers into risk tiers, surfacing the accounts that need urgent attention first. You can learn more about how to set up effective customer health scores and the models behind them.
Practical Application & Use Cases
Here’s how to apply this segmentation method:
Signals to Track:
- Usage Trends: Is login frequency or feature use increasing or decreasing?
- Support Interactions: Rising number of support tickets, particularly unresolved issues.
- Subscription Data: Tenure, recent plan changes (especially downgrades), and billing issues.
- Feedback & NPS: Low scores from recent surveys or negative feedback.
Example Thresholds:
- Healthy (80–100): High usage, positive feedback, long tenure.
- Needs Attention (50–79): Stagnant usage or recent unresolved support tickets.
- At-Risk (0–49): Declining usage, multiple failed payments, or has explicitly mentioned canceling.
Retention Playbook:
- For the Needs Attention segment, trigger a check-in from a CSM to offer proactive support or training.
- Target the At-Risk segment with an urgent, high-touch outreach campaign, potentially including a direct call or a special offer to address their concerns.
3. Revenue-Based Segmentation (MRR/ARR Tiers)
Revenue-based segmentation groups customers according to their financial contribution, typically measured by Monthly Recurring Revenue (MRR) or Annual Recurring Revenue (ARR). This is one of the most fundamental examples of customer segmentation for any subscription business because it aligns retention efforts directly with financial impact. It helps you prioritize resources where they matter most, focusing on the accounts that are most critical to your bottom line.
This method forces a pragmatic approach to customer success. Losing a $5,000 MRR enterprise client has a vastly different impact than losing a $50 MRR small business. By segmenting by revenue, teams can allocate their most valuable resources, like dedicated customer success managers, to their highest-value accounts.
Strategic Analysis & Actionable Insights
This approach is crucial for efficiently scaling retention strategies. It ensures that your highest-paying customers receive a level of service and attention commensurate with their value, preventing high-impact churn. It moves the conversation from simply reducing customer churn to actively protecting and growing revenue.
Key Insight: Not all churn is created equal. Focusing on customer count alone can mask serious revenue leakage. A tool like LowChurn is invaluable here, as it automatically ties Stripe revenue data to customer profiles, allowing you to instantly see which revenue tiers are at risk and prioritize outreach accordingly.
Practical Application & Use Cases
Here’s how to apply this segmentation method:
Signals to Track:
- MRR/ARR Value: The absolute recurring revenue from each customer.
- Plan Tier: The specific subscription plan (e.g., Basic, Pro, Enterprise).
- Customer Lifetime Value (CLV): The total predicted revenue from an account.
- Revenue Growth/Contraction: Changes in MRR over time (upgrades, downgrades).
Example Thresholds:
- Enterprise: >$2,000 MRR
- Mid-Market: $500 - $1,999 MRR
- SMB: <$500 MRR
Retention Playbook:
- For the Enterprise segment, assign a dedicated Customer Success Manager for quarterly business reviews and proactive check-ins.
- Target the Mid-Market segment with high-touch automated campaigns and group onboarding webinars.
- For SMB users, rely on a product-led approach with in-app guides, a robust knowledge base, and automated email support.
4. Subscription Lifecycle Stage Segmentation
This method segments customers based on their position in the subscription journey: new, early-stage, established, at-risk, and churned. This lens is critical for SaaS because customer needs, churn risks, and intervention strategies differ dramatically at each point. A brand-new customer requires intensive onboarding, while a long-term, established user is a candidate for expansion.
Unlike static segmentation, lifecycle stage is dynamic and time-based. It acknowledges that a customer's relationship with your product evolves, and your communication and support must adapt accordingly. This is a foundational approach among examples of customer segmentation for proactively managing the entire customer journey.
Strategic Analysis & Actionable Insights
This method is crucial for allocating resources effectively. The first 30-90 days are where early-stage churn is highest, demanding front-loaded investment in onboarding and education. For established customers, the focus shifts to value reinforcement, cross-selling, and advocacy. Failing to differentiate between these stages means you might offer an advanced feature to a user who hasn't even mastered the basics.
Key Insight: Churn drivers are different at each lifecycle stage. Early churn is often caused by poor onboarding or a value gap, while late-stage churn might be due to a competitor, budget changes, or evolving needs. Tools like LowChurn automatically track subscription tenure via Stripe to apply stage-appropriate churn prediction models.
Practical Application & Use Cases
Here’s how to apply this segmentation method:
Signals to Track:
- Subscription Age: How many days since their subscription started?
- Onboarding Completion: Have they completed key setup steps? (e.g., inviting a teammate, integrating a tool).
- Time to Value (TTV): How quickly did they reach their first "aha!" moment?
- Health Score Trends: Is their health score improving or declining within their current stage?
Example Thresholds:
- New: 0-30 days post-signup.
- Early-Stage: 31-90 days, moving from setup to regular use.
- Established: 91+ days, consistent usage patterns.
- At-Risk: Can be triggered at any stage by churn signals (e.g., credit card failure, usage drop).
Retention Playbook:
- For New users, trigger an automated onboarding email sequence, like Calendly does for its first 7 days.
- For Established users, send case studies and content about advanced features to drive deeper adoption and identify upsell opportunities. For a detailed guide on this, learn more about the stages of the customer lifecycle.
5. Firmographic Segmentation (Company Size, Industry, Region)
Firmographic segmentation is the B2B equivalent of demographic segmentation, categorizing customers based on company attributes. This method focuses on characteristics like employee count, industry vertical, geographic location, and company stage (e.g., startup vs. enterprise). For SaaS businesses, this is a foundational example of customer segmentation because needs, buying power, and usage patterns vary dramatically between a 5-person startup and a 500-person corporation.
This approach helps tailor marketing messages, product positioning, and pricing tiers to specific business profiles. For instance, an enterprise client in the healthcare industry will have different compliance needs and budget constraints than a tech startup, and firmographic data makes it possible to address those differences proactively.
Strategic Analysis & Actionable Insights
This method is crucial for aligning your product's value proposition with the specific pain points of different market segments. While a startup might prioritize speed and ease of use, an enterprise will focus on security, scalability, and integration capabilities. Ignoring these firmographic distinctions leads to generic messaging that fails to resonate.
Key Insight: Firmographic data provides context, but it doesn't predict behavior on its own. While tools like LowChurn focus on subscription and usage signals for churn prediction, many teams layer firmographic data from enrichment tools to create richer, more contextual customer health scores. A high-growth startup and a stable enterprise might show similar usage, but their long-term potential and churn risk are entirely different.
Practical Application & Use Cases
Here’s how to apply this segmentation method:
Signals to Track:
- Company Size: Number of employees (e.g., 1-10, 11-50, 51-200, 201+).
- Industry Vertical: Technology, Healthcare, Finance, E-commerce, etc.
- Geography: North America, EMEA, APAC.
- Company Stage: Startup, Growth-stage, Enterprise.
Example Thresholds:
- SMB: 1-50 employees, often in a general tech or services industry.
- Mid-Market: 51-500 employees, may have specialized needs by vertical.
- Enterprise: 501+ employees, requires high-touch support and security compliance.
Retention Playbook:
- For the SMB segment, create automated, low-touch onboarding flows that emphasize quick wins and self-service support.
- Target your Enterprise segment with a dedicated customer success manager, quarterly business reviews (QBRs), and case studies from their specific industry.
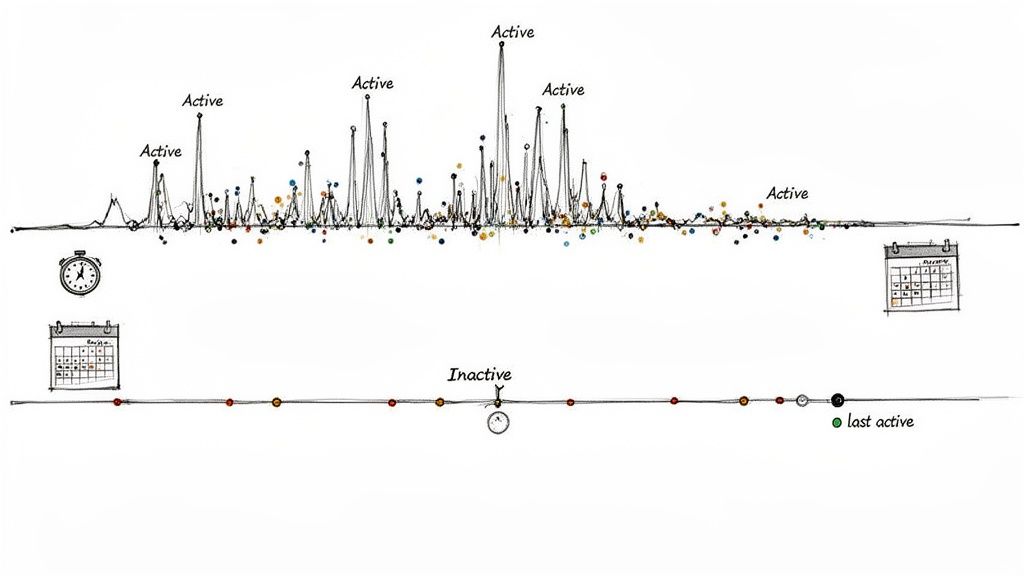
6. Engagement Frequency Segmentation (Active vs. Inactive Users)
Engagement frequency segmentation categorizes users based on how often they interact with your product. This is one of the most fundamental examples of customer segmentation because it directly measures habit-formation and dependency. It’s a simple but powerful way to distinguish between your power users and those who are silently drifting toward churn.
Unlike looking at a single point in time, this method tracks activity patterns, separating daily active users from those who log in weekly or have become completely dormant. For SaaS companies, engagement is a direct proxy for value; if a customer isn't logging in, they aren't receiving value and are at an extreme risk of cancellation.
Strategic Analysis & Actionable Insights
This approach is critical for identifying at-risk accounts before they cancel their subscription. A customer who hasn't logged in for 30 days is effectively already churned, they just haven't completed the paperwork. Tracking engagement velocity, or the change in frequency, provides an early warning system. For example, a user dropping from daily to weekly activity is a red flag.
Key Insight: A sudden drop in engagement is a leading indicator of churn. Tools like LowChurn are built to detect these changes automatically by monitoring login frequency and feature usage in real-time, surfacing sudden engagement drops as predictive churn signals before it’s too late.
Practical Application & Use Cases
Here’s how to apply this segmentation method:
Signals to Track:
- Last Seen At: The timestamp of the user's last activity.
- Session Count: The number of sessions within a specific period (e.g., last 7, 30, or 90 days).
- Engagement Velocity: The rate of change in login frequency over time. Is activity increasing or decreasing?
- Time Between Sessions: How many days typically pass between user logins?
Example Thresholds:
- Power User: Logs in daily or 4+ times per week.
- Casual User: Logs in 1-3 times per week.
- At-Risk: No login in the last 14 days.
- Inactive/Dormant: No login in the last 30+ days.
Retention Playbook:
- Enroll At-Risk users into an automated email campaign showcasing new features or a relevant case study.
- For Inactive/Dormant users, trigger a personal outreach from a customer success manager to diagnose their issues and offer assistance. For example, GitHub flags organizations with no commits in 90 days to trigger re-engagement emails.
7. NPS and Satisfaction-Based Segmentation
This segmentation method groups customers based on their expressed sentiment and loyalty, measured through feedback mechanisms like Net Promoter Score (NPS), Customer Satisfaction (CSAT), or Customer Effort Score (CES). NPS is particularly powerful, categorizing users into Promoters (score 9–10), Passives (7–8), and Detractors (0–6).
Unlike behavioral data which shows what users do, satisfaction-based segmentation reveals how they feel about your product and brand. It uncovers the emotional connection, or lack thereof, that drives long-term loyalty, expansion revenue, and word-of-mouth growth. This makes it one of the most predictive examples of customer segmentation for future churn.
Strategic Analysis & Actionable Insights
This method is critical for understanding the "why" behind customer behavior. A highly engaged user who is secretly a Detractor is a significant, hidden risk. Their high usage might be driven by necessity, not satisfaction, making them vulnerable to competitors. Conversely, a Promoter may be a prime candidate for a case study or an upgrade, even if their usage is only moderate.
Key Insight: NPS is a powerful leading indicator of future churn, often signaling risk 2-6 months before a customer cancels. A sudden drop in a customer's score is an immediate red flag that requires intervention. Integrating this feedback with a tool like LowChurn adds a crucial qualitative layer to quantitative health scores, explaining why an account is at-risk.
Practical Application & Use Cases
Here’s how to apply this segmentation method:
Signals to Track:
- NPS Score: The 0–10 rating itself.
- NPS Category: Promoter, Passive, or Detractor.
- Qualitative Feedback: The open-ended comments explaining the score.
- Score Trend: Is a customer's NPS score improving or declining over time?
Example Thresholds:
- Promoter: Score of 9 or 10. Candidates for testimonials and beta programs.
- Passive: Score of 7 or 8. Vulnerable to competitive offers; need proactive engagement.
- Detractor: Score of 0 to 6. High churn risk; require immediate follow-up.
Retention Playbook:
- For Detractors, trigger an automated workflow that creates a priority support ticket and alerts their dedicated Customer Success Manager for immediate outreach.
- Target Passives with educational content or webinars that showcase advanced features to increase their perceived value and turn them into Promoters.
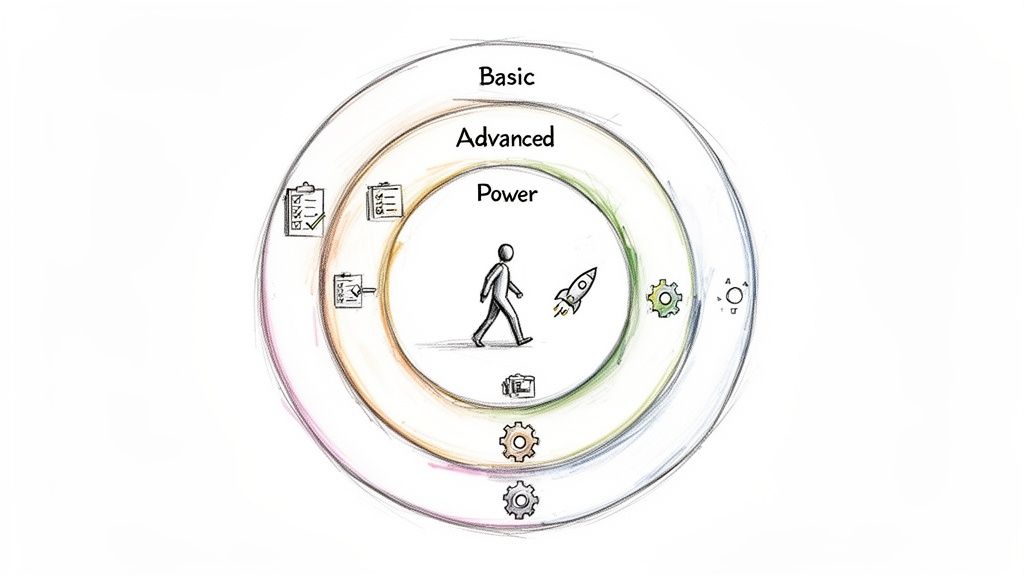
8. Feature Adoption Segmentation (Feature-Use Tiers)
Feature adoption segmentation groups customers based on which specific product features they use and how deeply they engage with them. It goes beyond simple activity metrics to understand how customers derive value. For instance, a project management tool might separate users who only create basic tasks from those who utilize advanced collaboration features, integrations, and automation.
This is one of the most insightful examples of customer segmentation because it directly links product engagement to customer stickiness. Customers who adopt and integrate multiple high-value features into their daily workflows are far less likely to churn and are prime candidates for expansion revenue.
Strategic Analysis & Actionable Insights
This method reveals your product's "stickiest" features and shows which customers are fully invested versus those only scratching the surface. It provides a clear roadmap for customer education, highlighting where to guide users to unlock more value and deepen their dependency on your platform.
Key Insight: Not all features are created equal. Identifying and driving adoption of "power features" that correlate with high retention is a critical growth lever. LowChurn helps by tracking the adoption of specific features, allowing you to see which patterns are common among your best customers and which are missing from at-risk accounts.
Practical Application & Use Cases
Here’s how to apply this segmentation method:
Signals to Track:
- Feature Breadth: The total number or percentage of core features used.
- Feature Depth: Usage of advanced settings or capabilities within a feature.
- Adoption of "Sticky" Features: Use of features known to correlate with long-term retention (e.g., integrations, team collaboration tools).
- Adoption Velocity: The time it takes a new user to adopt their first key feature.
Example Thresholds:
- Power User: Utilizes 80%+ of core features, including advanced automation and integrations.
- Core User: Actively uses 2-3 primary features but has not explored advanced capabilities.
- Dabbler: Has only adopted one basic feature and usage is infrequent.
Retention Playbook:
- Target Core Users with a campaign showcasing an adjacent advanced feature that complements their current workflow.
- For Dabblers, trigger a series of in-app product tours or educational emails focused on achieving a specific "quick win" with a second key feature.
9. Cohort-Based Segmentation (Acquisition Cohorts, Vintage Cohorts)
Cohort-based segmentation groups customers based on a shared characteristic within a specific timeframe, most commonly their sign-up date. This approach moves beyond individual user behavior to analyze group performance over time, revealing powerful trends about product changes, marketing effectiveness, and long-term customer value. It is one of the most vital examples of customer segmentation for understanding business health.
Unlike a simple snapshot, cohort analysis tracks retention and churn curves for specific groups. This allows you to see if a product update in March actually improved retention for customers who signed up in April, or if a new marketing channel is bringing in less loyal users.
Strategic Analysis & Actionable Insights
This method is the gold standard for measuring churn trends and the impact of retention initiatives. It helps you answer critical questions like: "Are our recent product improvements making customers stick around longer?" or "Which marketing campaigns attract customers with the highest lifetime value?" Without it, you are flying blind, unable to distinguish between short-term noise and long-term trends.
Key Insight: Retention is not a static number; it evolves. By comparing retention curves of different cohorts (e.g., Q1 vs. Q2 signups), you can directly measure the impact of your strategic decisions. A tool like LowChurn automatically builds these curves from Stripe data, visualizing whether your churn-reduction efforts are truly working.
Practical Application & Use Cases
Here’s how to apply this segmentation method:
Signals to Track:
- Acquisition Date: Group users by week, month, or quarter of sign-up (e.g., "January 2024 Cohort").
- Acquisition Source: Segment by the channel that brought them in (e.g., "Organic Search," "Paid Social," "Partner Referral").
- First Feature Used: Group users by the first major action they took, which often indicates their primary use case.
Example Thresholds:
- High-Performing Cohort: Retains 80%+ of users after 90 days (e.g., users from a specific partner referral).
- Underperforming Cohort: Shows a steep drop-off, retaining less than 50% of users after 30 days (e.g., users from a new paid ad campaign).
- Improving Trend: Each new monthly cohort shows a 2% higher retention rate at the 60-day mark compared to the previous one.
Retention Playbook:
- For an Underperforming Cohort from a paid ad campaign, re-evaluate the ad copy and targeting to attract a better-fit audience.
- Analyze your High-Performing Cohorts to identify their common behaviors and replicate those success patterns in your onboarding for new users. To dive deeper, you can learn more about cohort analysis and its applications.
10. Win-Back and Reactivation Segmentation (Churned Customers)
Win-back segmentation focuses on customers who have already canceled their subscriptions. Instead of treating all churned users as a lost cause, this strategy categorizes them based on when they left and why. It recognizes that the window of opportunity to re-engage a former customer shrinks over time, requiring different tactics for each stage.
This is a critical example of customer segmentation because acquiring a new customer is significantly more expensive than reactivating a churned one. By understanding the profile of a churned user, you can tailor your outreach to address their specific reasons for leaving, turning a lost account into a profitable second-chance relationship.
Strategic Analysis & Actionable Insights
This method provides a structured approach to a high-ROI activity that many SaaS businesses neglect. It allows you to move beyond generic "we miss you" emails and deploy surgical campaigns based on churn timing and original pain points. For example, a customer who churned 15 days ago is far more likely to respond to a small discount than one who left a year ago.
Key Insight: The reason for churn is the key to reactivation. Capturing cancellation feedback is not just for internal review; it's the raw material for your win-back campaigns. A customer who left over a missing feature is a prime reactivation candidate once you've shipped it.
Practical Application & Use Cases
Here’s how to apply this segmentation method:
Signals to Track:
- Time Since Churn: When did the subscription officially end?
- Churn Reason: Was it price, missing features, poor support, or switching to a competitor?
- Previous Value: Was this a high-LTV customer or a low-tier user?
- Previous Engagement: Were they a power user or an inactive subscriber before churning?
Example Thresholds:
- Recent Churners (0-30 days): Still familiar with the product; decision may be soft.
- Warm Churners (31-90 days): Have likely evaluated alternatives; need a compelling reason to return.
- Cold Churners (90+ days): Have forgotten the product's value; require a complete re-onboarding pitch.
Retention Playbook:
- Target Recent Churners who cited price with a limited-time discount offer within 7 days.
- For Warm Churners who left over a product gap, send a "What's New" email campaign once the feature they wanted is live.
- Approach high-value Cold Churners with a personal outreach from a founder or senior team member, offering a demo of the new-and-improved platform.
10 Customer Segmentation Methods Comparison
| Segmentation Method | 🔄 Implementation complexity | ⚡ Resource requirements & speed | ⭐ Expected outcomes & quality | 💡 Ideal use cases | 📊 Key advantages / Impact |
|---|---|---|---|---|---|
| Behavioral Segmentation by Product Usage Patterns | High — requires precise event instrumentation and real‑time pipelines | Medium–High — product analytics, data engineering, Stripe integration; moderate latency | High predictive power (early churn signals 7–30 days); actionable at user & account level | Product-led SaaS with rich feature sets; proactive churn prevention | Most predictive of churn; surfaces features that drive retention |
| Churn Risk Segmentation by Health Score | Medium — model design and ongoing calibration | Medium — aggregated signals, scoring engine; updates must be frequent | High accuracy for prioritization (real‑time risk surfacing; reduces false positives) | CS teams needing triage, routing, and automated workflows | Simplifies prioritization with single actionable metric; drives efficient outreach |
| Revenue-Based Segmentation (MRR/ARR Tiers) | Low — based on billing tiers and simple rules | Low — uses Stripe/billing data; fast to implement | Medium — focuses on business impact rather than pure churn prediction | Founders, finance, and teams prioritizing high‑value accounts | Aligns retention with revenue impact; justifies high‑touch support for premium accounts |
| Subscription Lifecycle Stage Segmentation | Low–Medium — tenure tracking and stage definitions | Low — uses subscription start date (Stripe) + minimal data | Medium — prevents early churn via stage‑specific interventions | Onboarding optimization, trial-to-paid conversion, lifecycle campaigns | Targets stage‑specific churn drivers; enables tailored automations by tenure |
| Firmographic Segmentation (Company Size, Industry, Region) | Medium — enrichment and mapping required; data staleness risk | Medium–High — third‑party enrichment (ZoomInfo, Apollo); continuous updates | Variable — informs GTM and messaging; indirect churn signal | ABM, vertical GTM, regional expansion planning | Enables tailored positioning and reveals market‑specific churn drivers |
| Engagement Frequency Segmentation (Active vs. Inactive Users) | Low — track logins/DAU/MAU and last‑seen timestamps | Low — standard analytics suffice; fast detection and triggers | High — highly predictive; quick re‑engagement ROI | Immediate reactivation campaigns; detect sudden drops in activity | Fast identification of at‑risk users; low implementation overhead |
| NPS and Satisfaction-Based Segmentation | Low–Medium — survey cadence and sentiment processing | Medium — survey tooling, response analysis; slower signal | Medium — leading indicator (2–6 months); explains “why” behind churn | Voice‑of‑customer programs, enterprise escalation and feedback loops | Reveals emotional drivers and root causes; surfaces promoters for expansion |
| Feature Adoption Segmentation (Feature‑Use Tiers) | Medium–High — requires feature‑level event tracking and definitions | Medium — product analytics, onboarding tools; can be complex for large products | High — predicts stickiness and expansion potential | PLG growth, feature education, upsell targeting | Identifies stickiness drivers and UX friction; supports targeted education |
| Cohort‑Based Segmentation (Acquisition/Vintage Cohorts) | Medium — needs consistent acquisition tagging and time‑series analysis | Low–Medium — basic analytics + good tagging; longer observation windows | High for trend analysis — measures impact of changes over time | Experimentation, pricing/product changes, retention trend monitoring | Isolates effects of product/market changes; shows cohort retention curves |
| Win‑Back and Reactivation Segmentation (Churned Customers) | Low–Medium — track churn recency and reasons; build reactivation flows | Medium — marketing automation, coordinated sales/CS effort; time‑sensitive | Medium — cost‑effective reacquisition (best within 30–90 days) | Reactivation campaigns, recovering high‑MRR churners | Lower CAC than new acquisition; good ROI when acted on quickly |
From Segments to Strategy: Activating Your Customer Insights
Throughout this article, we’ve explored a diverse range of powerful examples of customer segmentation, moving far beyond generic categories into the actionable, data-rich segments that drive modern SaaS growth. From tracking behavioral product usage patterns and dynamic health scores to segmenting by MRR tiers and subscription lifecycle stages, a clear pattern emerges: the most effective strategies are never one-dimensional. They blend financial data from your Stripe account with real-time user engagement metrics to create a multidimensional view of your customer base.
The journey doesn't end with identifying these groups. The real transformation happens when you move from passive analysis to active, automated intervention. Knowing which customers are "at-risk" based on a declining health score is insightful; automatically enrolling them into a CSM-led check-in playbook is impactful. Recognizing a "power user" segment is great; proactively offering them an early look at a new feature to deepen their loyalty is a game-changer. This is the critical leap from data to strategy.
Your Blueprint for Activating Segmentation
To turn the examples we've discussed into a core part of your operations, focus on a structured, iterative approach. Don't try to implement all ten models at once. Instead, build a foundation and expand from there.
1. Start with the Core Signals: Begin by connecting your primary data sources. For most SaaS businesses, this means integrating your Stripe subscription data (MRR, plan type, invoice failures) with your product usage data (login frequency, key feature adoption, session duration). This combination provides the most potent, immediate insights into customer health and churn risk.
2. Prioritize High-Impact Segments First: Focus on the segments that present the biggest immediate threat or opportunity. This almost always includes:
- Churn Risk Segmentation: Identifying customers with low health scores or leading indicators of cancellation.
- Revenue-Based Segmentation: Protecting your highest-value accounts (your top MRR/ARR tiers) with dedicated resources.
- Engagement Frequency Segmentation: Re-engaging inactive or "slipping away" users before they become a lost cause.
3. Define and Automate Your Playbooks: For each priority segment, define a specific, repeatable "playbook." What action do you take when a high-value customer’s health score drops by 20 points? What email sequence is triggered when a user hasn't logged in for 14 days? Documenting and then automating these responses ensures consistency and scalability.
Moving Beyond the Basics
As you master these foundational segments, you can layer on more sophisticated models. Firmographic data can help you understand if your product resonates more with SMBs or enterprise clients in a specific industry. NPS and satisfaction scores can add a crucial layer of qualitative feedback to your quantitative health metrics. And win-back segmentation ensures you don’t give up on churned customers who might be prime for reactivation with the right offer.
Before diving into these specific strategies, it's essential to have a clear understanding of what customer segmentation entails and how it contributes to unlocking growth. For a deeper dive into the foundational principles, this guide on What Is Customer Segmentation offers a comprehensive overview.
Ultimately, mastering these examples of customer segmentation is about more than just organizing customers into lists. It’s about building a proactive, data-driven engine for retention and expansion. It’s about understanding your customers so deeply that you can anticipate their needs, solve their problems before they arise, and guide them toward success with your product. By turning raw data into strategic action, you transform customer segmentation from an academic exercise into your most powerful tool for sustainable MRR growth.
Ready to stop analyzing and start acting? LowChurn connects directly to your Stripe and product data to automatically generate the dynamic health scores and at-risk segments discussed here. Stop churn before it happens by turning these examples of customer segmentation into automated, one-click retention playbooks with LowChurn.