At its heart, the formula for retention ratio is a simple but powerful health check for your business. You just take the total number of customers you have at the end of a period, subtract all the new customers you gained during that time, and divide that number by the customers you started with.
This calculation gives you a percentage that tells you one critical thing: how many of your existing customers are sticking around.
Understanding the Retention Ratio Formula
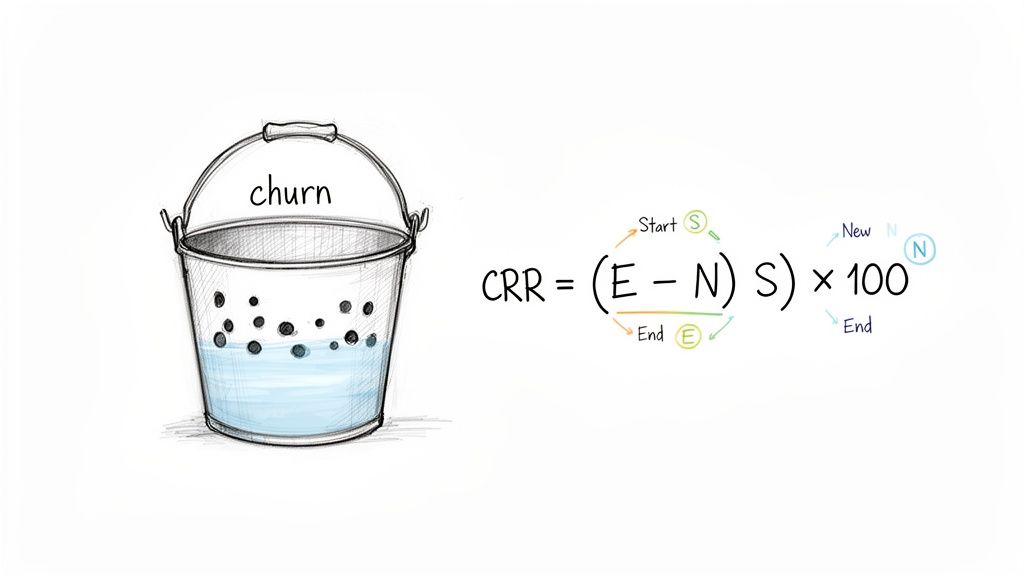
I always tell founders to think of their business like a bucket. You're constantly pouring new customers in the top, but there are always a few holes in the bottom where existing customers "leak" out. This is churn.
The Customer Retention Ratio (CRR), often just called Customer Retention Rate, is the best way to measure how good you are at plugging those leaks. It's a gut check that tells you if your business is truly healthy or just looks busy because you're acquiring new customers as fast as you're losing old ones.
Without it, you can easily get fooled. A big influx of new sign-ups might feel like success, but if your existing customers are quietly walking out the back door, you have a serious problem. The retention ratio strips away the noise from new acquisitions and focuses purely on the loyalty of the customers you already have. It’s a direct signal of your product-market fit.
The Standard Retention Formula
Let's break down the classic formula. It’s wonderfully simple and only needs three numbers from a specific timeframe, whether that's a month, a quarter, or a year.
- S: The number of customers you had at the Start of the period.
- E: The total number of customers you had at the End of the period.
- N: The number of New customers you signed up during that period.
Once you have those, the math is straightforward.
Customer Retention Ratio (CRR) = [ (E - N) / S ] * 100
That little (E - N) part is the secret sauce. By subtracting the new customers from your ending total, you isolate the original group of customers. This is absolutely critical. If you skip this step, your new sign-ups will mask your churn, giving you a falsely optimistic number.
Keeping a close eye on your CRR is non-negotiable. For a B2B SaaS company, a good annual retention rate is often in the ballpark of 90% or more. Hitting a high number like that is proof that you’ve built something people truly value—and it’s one of the most reliable predictors of sustainable, long-term growth.
Key Retention Formulas at a Glance
As we go deeper, you'll see a few different ways to measure retention. Here’s a quick-reference table to keep the main formulas straight.
| Metric Name | Formula | What It Measures |
|---|---|---|
| Customer Retention Ratio | [ (E - N) / S ] * 100 |
The percentage of existing customers who remained active over a period. |
| Cohort Retention | (Remaining Customers / Initial Size) * 100 |
The retention of a specific group (cohort) of customers over their entire lifecycle. |
| Net Revenue Retention | [ (MRR Start + Expansion - Churn) / MRR Start ] * 100 |
The change in recurring revenue from a set of customers, including upgrades and churn. |
Each of these formulas tells a slightly different part of the story, but they all point back to the same fundamental question: are your customers sticking with you for the long haul?
Why Retention Rate Is Your SaaS Superpower
The retention rate formula does far more than just put a number on churn. It’s a direct look into the fundamental health of your entire business. In the cutthroat world of SaaS, you can't just keep pouring new customers into the top of a leaky bucket and hope for the best. Real, sustainable growth is built on keeping the customers you’ve already worked so hard to win.
Think of it this way: a high retention rate is a clear signal that you’ve achieved strong product-market fit and are keeping your customers happy. It’s proof that your product is delivering real, ongoing value, which is what turns a one-time sale into a long-term partnership. That kind of loyalty has a massive compounding effect on your bottom line.
Powering Growth and Profitability
When customers stick around longer, their Customer Lifetime Value (CLV) naturally goes up. This simple fact makes your business far more resilient and less reliant on the costly and often unpredictable hamster wheel of new customer acquisition. Getting that balance right is everything, which is why we explore the crucial relationship in our guide to the LTV/CAC ratio.
But it gets better. A strong retention rate is also a growth multiplier. Your loyal, long-term customers are the most likely to upgrade their plans, expand their usage, or try out new features—all of which directly boosts revenue without you spending a dime on marketing.
A high retention rate isn't just a defensive play against churn. It's your most powerful engine for offensive growth, turning happy customers into your single best source of new revenue.
In B2B SaaS, it helps to know where you stand. Recent survey data from KeyBanc Capital Markets and Sapphire Ventures pegs the average gross retention rate for private SaaS companies at around 90%. That translates to an annual churn rate of 10%, which shows just how vital retention is for the typical company in this space.
Your North Star for Strategic Decisions
Getting a handle on this metric gives you the clarity to make smarter decisions across the board. It tells you which customer segments are thriving, which product features create the most stickiness, and where your customer success team needs to focus its efforts.
Understanding how to use the retention ratio is a game-changer, especially when it informs your broader SaaS marketing efforts. At the end of the day, this simple formula is a superpower because it gives you an honest, unfiltered view of your company's health. It empowers you to build a business that doesn't just survive—it thrives.
Let's Calculate Customer Retention: A Step-by-Step Example
The theory is great, but let's be honest—nothing makes a metric stick like plugging in real numbers. So, let's walk through a practical example to take the mystery out of calculating customer retention for your own business.
We'll follow a fictional SaaS company, "SaaSify," as they figure out their customer retention for the first quarter of the year (January 1st to March 31st).
Finding the Key Data Points
First things first, we need three simple numbers. You can usually pull these straight from your subscription management platform or CRM.
Here's what SaaSify's Q1 data looks like:
- Customers at the Start (S): On January 1st, SaaSify had 500 active customers.
- Customers at the End (E): By March 31st, their total customer count grew to 620.
- New Customers Acquired (N): Over the quarter, they brought in 150 brand-new customers.
With these three pieces of information, we have everything we need to run the numbers.
Breaking Down the Calculation
Now it's time to use the Customer Retention Ratio (CRR) formula we talked about earlier:
CRR = [ (E - N) / S ] * 100
Here’s how it works for SaaSify, step-by-step:
Isolate Your Retained Customers: This is the most important step. We need to find out how many of the original customers stuck around. To do that, we simply subtract the new customers (N) from the total at the end of the period (E).
- 620 (E) - 150 (N) = 470
- This tells us that out of the 620 customers SaaSify had on March 31st, 470 of them were there from the very beginning of the quarter.
Find the Retention Proportion: Next, we divide that number of retained customers by the number of customers we started with (S). This gives us a simple ratio.
- 470 / 500 (S) = 0.94
Turn It Into a Percentage: Finally, just multiply that result by 100 to get a clean, easy-to-understand percentage.
- 0.94 * 100 = 94%
SaaSify’s Customer Retention Ratio for Q1 is 94%. This means they held onto 94% of the customers they had on day one of the quarter.
This calculation shows that even though their total customer count went up, they still lost 6% of their starting customer base (which is 30 customers) along the way. Seeing both sides of the coin—retention and its opposite, churn—is crucial for healthy growth.
To get a better handle on the other side of this equation, check out our guide on how to calculate churn rate. This straightforward approach gives you an honest look at customer loyalty, without getting distracted by the noise from new sales.
Taking Retention to the Next Level with Revenue Formulas
Counting customers is one thing, but tracking your revenue tells the real story of your company's health. While the basic customer retention rate is a great starting point, if you want to truly understand the financial pulse of your SaaS business, you need to look at revenue-centric formulas.
These advanced metrics go beyond a simple headcount. They measure the financial impact of your customer base over time, which is exactly what investors and seasoned executives care about. Two formulas, in particular, dominate this conversation: Gross Revenue Retention (GRR) and Net Revenue Retention (NRR). Mastering both is key to painting a complete picture of your company's resilience and potential for growth.
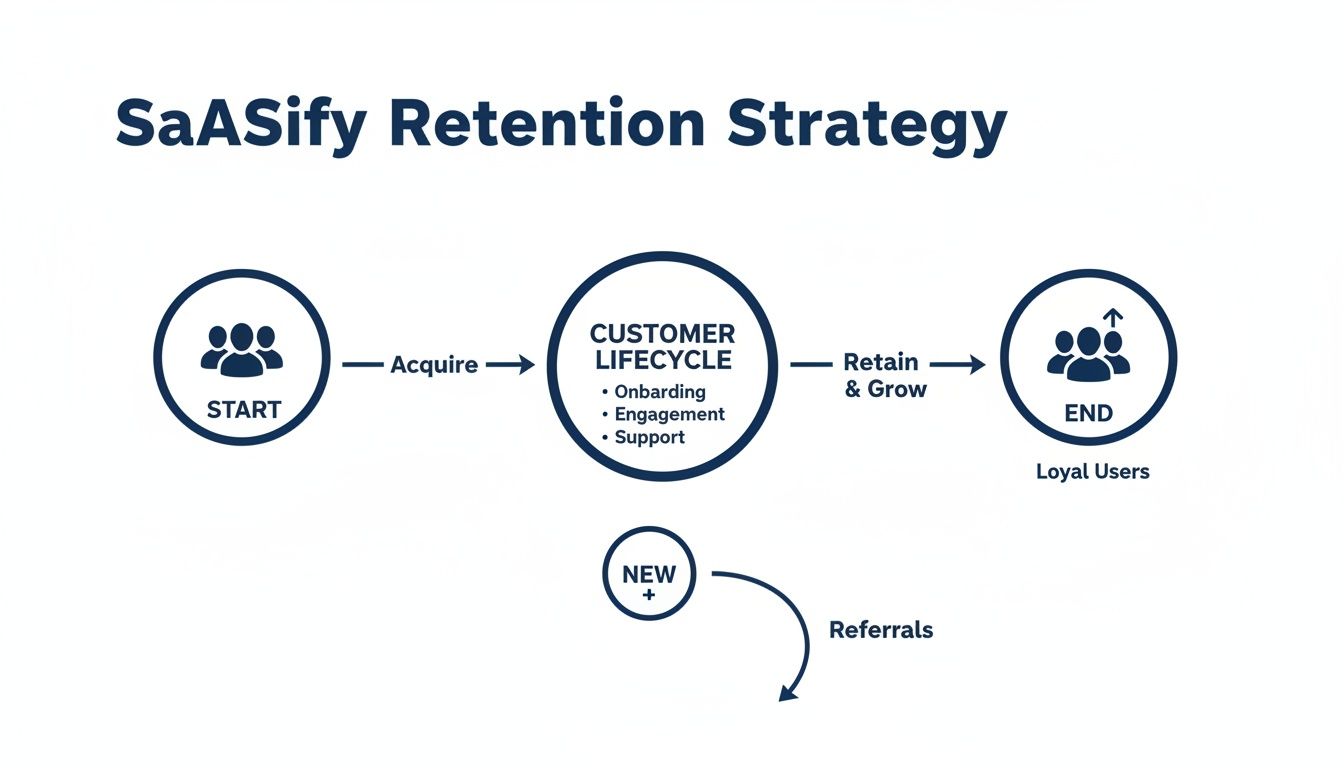
This flowchart shows how customers flow through your business, from new signups to loyal, long-term users. It helps visualize why we need to isolate the original group of customers to get a true reading on retention.
Gross Revenue Retention: The Purest Test of Value
Think of Gross Revenue Retention (GRR) as the ultimate stress test for your revenue. It answers one simple, sometimes brutal, question: How much of the money you started with from a specific group of customers did you actually keep?
Crucially, GRR intentionally ignores any new money from those customers—no upsells, no add-ons, no cross-sells. This makes it a pure measure of your ability to prevent revenue from leaking out due to downgrades and cancellations. A high GRR is a powerful signal that your core product is so valuable that customers rarely cut back on what they’re paying you.
Let's check in with our "SaaSify" example. Say they started Q1 with $50,000 in Monthly Recurring Revenue (MRR) from their existing customers.
- Starting MRR: $50,000
- Revenue Lost to Churn: $2,000 (from cancellations)
- Revenue Lost to Contractions: $1,000 (from downgrades)
The formula is pretty straightforward: [ (Starting MRR - Churn - Contractions) / Starting MRR ] * 100
So for SaaSify, that looks like: [ ($50,000 - $2,000 - $1,000) / $50,000 ] * 100 = 94%
Their GRR is 94%. This means for every dollar they had at the start of the quarter, they successfully held onto 94 cents. Not bad at all.
Net Revenue Retention: Your Engine for Growth
If GRR is about defense and resilience, then Net Revenue Retention (NRR) is all about offense and growth. NRR starts with the same calculation as GRR but adds one critical piece back into the mix: expansion revenue. This is all the extra money you generate from existing customers who upgrade their plans or buy more from you.
That one change transforms the metric. NRR tells you if your existing customer base, as a whole, is becoming more valuable, staying flat, or shrinking.
A healthy NRR above 100% means you have "negative churn." This is the holy grail for SaaS businesses. It means the new revenue you're generating from your current customers is more than enough to offset all the revenue you're losing from churn and downgrades.
Let's see how SaaSify stacks up. In that same quarter, they generated an extra $6,000 in expansion revenue from customers upgrading their plans.
The NRR formula adds that piece in: [ (Starting MRR + Expansions - Churn - Contractions) / Starting MRR ] * 100
Plugging in SaaSify's numbers: [ ($50,000 + $6,000 - $2,000 - $1,000) / $50,000 ] * 100 = 106%
SaaSify’s NRR is a fantastic 106%. Even after losing some customers and revenue, their business actually grew by 6% without acquiring a single new customer. That’s an incredibly powerful and efficient growth model.
The difference this makes is staggering. A ChartMogul analysis of over 2,100 SaaS companies found that businesses with NRR over 100% grow 43.6% annually. That absolutely dwarfs the 13.1% growth seen by companies with NRR below 60%. You can read more about this 3x growth gap and see just how critical this metric is.
How to Interpret Your Retention Metrics
Calculating your retention ratio is a huge first step, but the number itself is just the beginning of the story. A 94% retention rate could be fantastic for one business and a massive red flag for another. The real magic happens when you understand what that number is actually telling you.
Context is everything here. Without it, you’re just staring at data points. To really get a feel for your metrics, you need to compare them against the right benchmarks and, more importantly, track how they move over time. Is your retention rate trending up, holding steady, or silently slipping? That trend line is often far more revealing than any single snapshot.
Setting the Right Benchmarks
So, what’s a “good” retention rate, anyway? Honestly, it varies wildly depending on your customer base. The expectations for an enterprise SaaS product are worlds apart from a consumer-facing mobile app, which is why industry benchmarks are so critical for a fair comparison.
Different corners of the SaaS world have their own retention profiles. As a rough guide, a company like Salesforce, which serves huge enterprise clients, is aiming for 85–95% annual retention. A mid-market tool like Slack might target something closer to 70–85%, while consumer apps often see monthly retention land somewhere between 30–60%. This isn't just theory—recent data shows that B2B SaaS companies average around 74% annual retention. You can master the strategies for SaaS retention to get a better sense of how you stack up.
Having this context helps you set goals that are ambitious but realistic. Nailing 90% retention is a massive win for most B2B companies, but it might be a pipe dream if you’re selling a low-cost product directly to consumers.
Common Pitfalls in Metric Interpretation
Once you have your number and a benchmark to compare it against, it’s surprisingly easy to fall into a few common traps that can lead you down the wrong path. Knowing what these pitfalls are is the key to turning your data into real, actionable intelligence.
Here are a few classic mistakes to watch out for:
- Ignoring Segmentation: An overall retention rate can easily hide serious problems. You might have a high-value cohort churning like crazy while your low-value customers stick around, making your top-line number look perfectly fine. You have to segment your data by customer cohort, plan type, or acquisition channel to see what's really happening.
- Confusing Customer Count with Revenue Health: As we saw with Gross and Net Revenue Retention, the number of customers you keep doesn't tell the whole story. You could have a 95% customer retention rate but still be bleeding money if your highest-paying clients are the ones walking out the door.
- Focusing Only on the "What": Don't just track the number—get obsessed with the "why" behind it. The moment your retention dips, you need to be digging into product usage data, sifting through support tickets, and reading customer feedback to find the root cause before a small problem becomes a big one.
By sidestepping these errors and slicing your data in meaningful ways, you can turn a simple metric into a powerful diagnostic tool. To go even deeper, check out our guide on what cohort analysis is and how it can uncover the hidden trends shaping your business.
Turning Retention Insights Into Action
Calculating your retention ratio gives you a vital health score for your business, but that number is just the beginning. The real magic happens when you turn that data into a concrete strategy for reducing churn. This is the moment you shift from simply measuring the past to actively building a more profitable future.
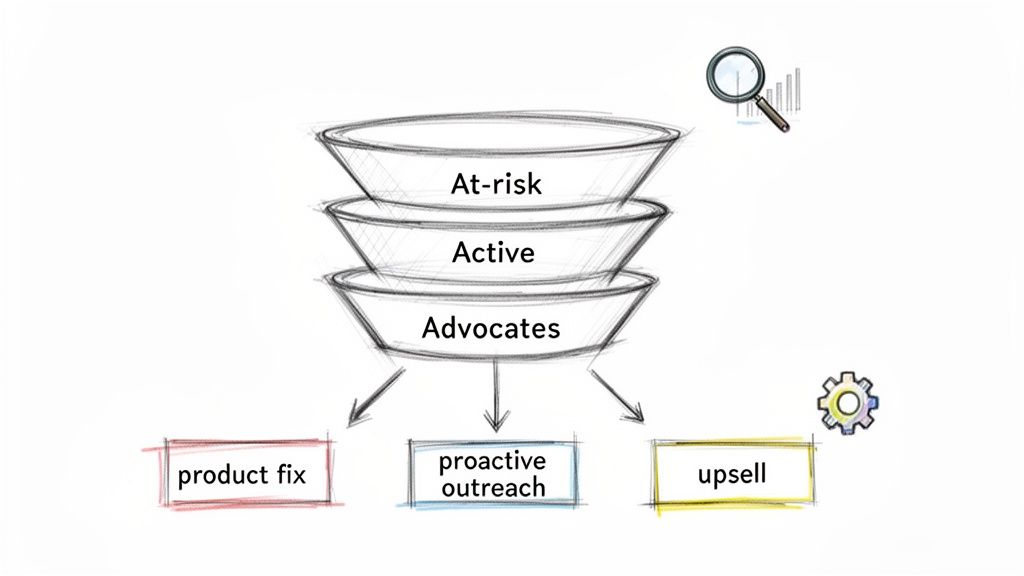
The first step is to use your retention data to find the leaks in your bucket. Is a particular pricing tier churning more than others? Do customers who signed up from a specific marketing campaign tend to leave faster? By pinpointing these at-risk groups, you can focus your energy where it’ll make the biggest difference.
Once you’ve figured out who is leaving, you need to understand why. This means diving headfirst into your product usage analytics. Look for friction points and signs of low engagement, like infrequent logins or key features that are gathering dust. These are the early warning signs that a customer isn't getting the value they hoped for and might be heading for the door.
Building a Proactive Retention Framework
With this knowledge in hand, you can stop being reactive. Instead of waiting for the cancellation email to hit your inbox, you can launch targeted outreach campaigns to re-engage customers before they decide to leave. This is where a simple formula becomes a powerful engine for growth.
A modern, actionable framework for this looks something like this:
- Predictive Churn Modeling: Using tools that analyze user behavior to forecast which accounts are most likely to churn soon.
- Real-Time Health Scoring: Assigning a dynamic "health score" to each customer based on how they use your product, their subscription status, and support history.
- Automated Outreach Triggers: Setting up smart, personalized email sequences or in-app messages that kick in automatically when a customer's health score dips.
This data-driven approach transforms retention from a hopeful wish into a deliberate business process. It gives your team the power to step in at the perfect moment with the right message, turning a potential churn event into an opportunity to strengthen a relationship.
Solutions like LowChurn are built specifically for this. By connecting directly to your Stripe data and product analytics, these platforms can automatically surface at-risk accounts. They essentially give you the early-warning system you need to protect your recurring revenue. By acting on these insights, you stop just calculating retention and start actively improving it.
Unpacking the Retention Formula: Your Questions Answered
When you start digging into retention metrics, a few common questions always pop up. Let's tackle them head-on, so you can apply these formulas with confidence.
What Is a Good Retention Ratio for B2B SaaS?
There's no single magic number, but we can talk about strong benchmarks. For most B2B SaaS companies, aiming for an annual customer retention rate of 90% or more is a great goal.
It really depends on who you sell to. If you're focused on large enterprise clients, you'll want to aim even higher—think 95% or more. The stakes are higher with those big contracts, so every churned customer hurts a lot more. On the flip side, if your business serves a high volume of SMBs, a retention rate in the 80-85% range is often a very healthy and realistic target.
How Often Should I Calculate Retention?
Consistency is more important than the specific interval, but a good rhythm for most SaaS businesses is to calculate retention on both a monthly and quarterly basis.
Monthly checks are your early-warning system. They help you catch problems fast before they snowball. Quarterly and annual calculations smooth out the month-to-month noise, giving you a clearer picture of the bigger trends shaping your business.
Can Net Revenue Retention Exceed 100%?
Yes, it absolutely can—and that’s the holy grail for a thriving SaaS company.
When your Net Revenue Retention (NRR) climbs over 100%, it means the new revenue you're generating from your existing customers through upgrades, add-ons, and cross-sells is outpacing the revenue you're losing from cancellations and downgrades. This is often called "negative churn," and it's a powerful sign that your business can grow even without acquiring a single new customer.
Ready to turn retention insights into action? LowChurn uses AI to predict which Stripe customers are likely to churn and gives you the tools to save them before they cancel. See how it works at https://www.lowchurn.com.