At its core, the LTV:CAC ratio is the ultimate health score for your business. It pits two crucial metrics against each other: the total value you get from a customer (Lifetime Value or LTV) and what it cost you to get them in the door (Customer Acquisition Cost or CAC).
A healthy ratio, with 3:1 being the gold standard, proves you have a sustainable business model. It's simple, powerful proof that you earn significantly more from your customers than you spend to acquire them.
Why the LTV:CAC Ratio Is Your Growth Compass
Imagine your business is a high-performance engine. Your marketing and sales spend is the fuel, and the revenue you generate over a customer's lifetime is the horsepower. The LTV:CAC ratio tells you just how efficient that engine is.
Are you burning through cash just to keep the lights on? Or is every dollar you spend on acquisition creating a powerful, long-term return? This one number cuts through the noise and provides a clear verdict on the viability of your entire business model. It answers the most critical question for any founder or investor: is this company built to last?
Getting a handle on this ratio is fundamental to making smart, data-driven decisions that actually move the needle.
It helps you figure out:
- Marketing Efficiency: Are your ad campaigns bringing in profitable customers, or are certain channels just a money pit?
- Financial Health: Is the company on a solid path to long-term profitability, or are you operating on borrowed time and burning cash too quickly?
- Investor Confidence: Can you walk into a room and prove to investors that your unit economics are sound and their capital will generate a powerful return?
The 3:1 Golden Ratio for SaaS
For most SaaS businesses, the industry benchmark to aim for is a 3:1 LTV to CAC ratio. This is often called the "golden ratio" because it signals a healthy, balanced, and scalable business. In plain terms, it means for every $1 you spend to acquire a customer, you can expect to get $3 back over their lifetime with you.
But hitting a specific number isn't the whole story. It’s about understanding what that number signals. A deep understanding of the LTV:CAC ratio starts with mastering the concept of SaaS Customer Lifetime Value and how it directly impacts your growth trajectory. A ratio below the ideal target can signal serious trouble, while one that's way too high might mean you're leaving growth on the table.
A healthy LTV:CAC ratio demonstrates that you've not only found product-market fit but also a sustainable way to scale. It’s the proof that your customer acquisition engine isn't just running—it's running profitably.
Understanding Your LTV CAC Ratio at a Glance
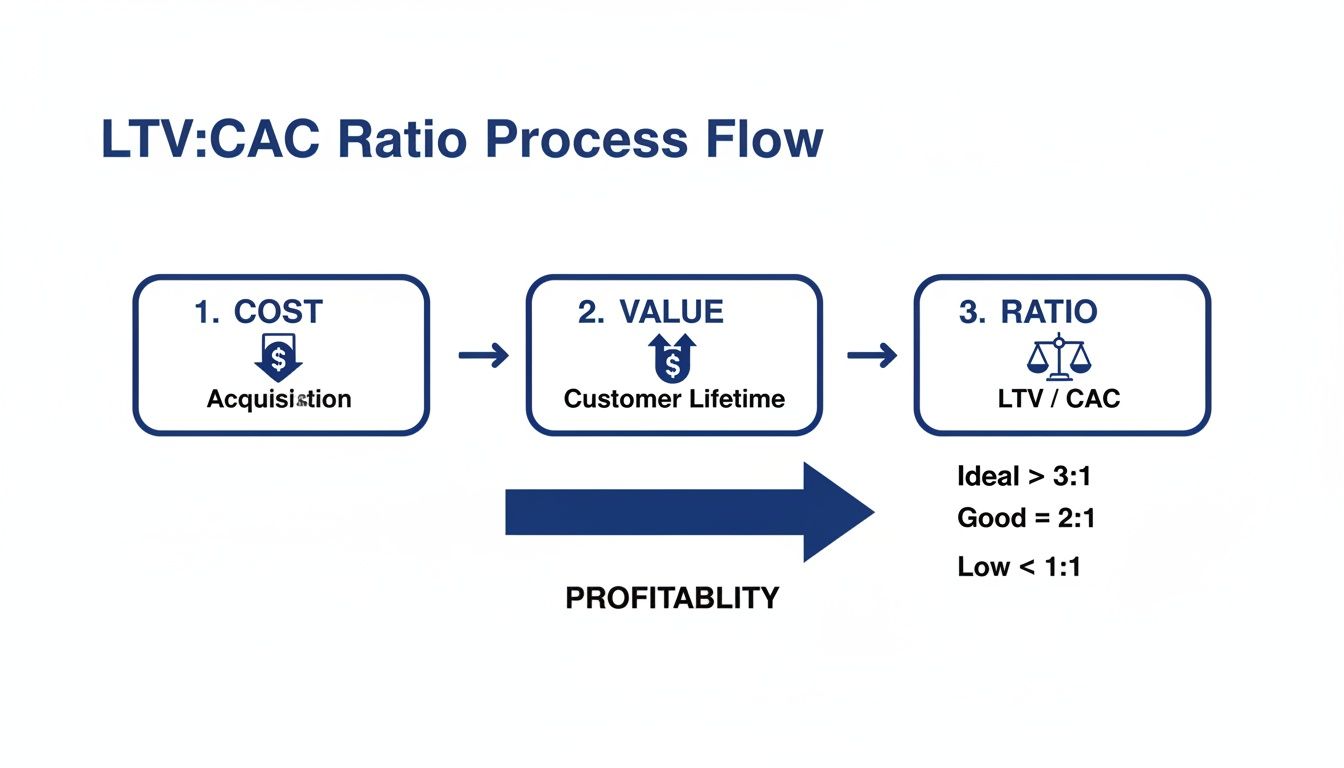
Different ratios tell completely different stories about your company's health and where your strategy might be headed. A ratio below 1:1 is a five-alarm fire, while a 5:1 ratio might suggest you're not investing aggressively enough to capture your market.
This quick reference table helps demystify what your LTV:CAC ratio is telling you.
| LTV CAC Ratio | Business Health Status | Strategic Implication |
|---|---|---|
| Less than 1:1 | Unsustainable | You're losing money on every single customer you bring in. |
| 1:1 | Breakeven | You're just recovering acquisition costs but generating zero profit. |
| 3:1 | Healthy and Sustainable | The ideal target. This indicates a profitable model with room to reinvest. |
| 5:1 or Higher | Potentially Under-investing | You could be missing growth opportunities by not spending enough on acquisition. |
Think of this table as a quick diagnostic tool. It helps you instantly contextualize your performance and decide whether you need to fix a leaky bucket or pour more fuel on the fire.
How to Accurately Calculate Your LTV and CAC
Getting your LTV:CAC ratio right starts with solid, honest math. The formulas themselves are pretty simple, but the quality of your inputs makes all the difference. It's what separates a genuinely useful strategic tool from a misleading vanity metric.
Let's break down how to calculate both sides of this critical equation, using some real-world numbers.
The basic idea is a flow from cost to value. You spend money to get a customer, and then that customer generates value over time. For a healthy business, that value must outweigh the initial cost.
Calculating Customer Lifetime Value (LTV)
Customer Lifetime Value (LTV) is a forecast. It predicts the total revenue you can reasonably expect from a single customer over the entire time they stick with you. Think of it as the total worth of that customer relationship.
Here's the go-to formula for SaaS:
LTV = (Average Revenue Per Account × Gross Margin %) / Customer Churn Rate
To make this less abstract, let’s imagine a SaaS company called "SyncUp."
- Average Revenue Per Account (ARPA): This is just your total monthly recurring revenue (MRR) divided by your number of customers. If SyncUp has $50,000 in MRR from 500 customers, its ARPA is $100.
- Gross Margin %: This is your profitability after accounting for the direct costs of delivering your service (think hosting, API calls, and dedicated support tools). If SyncUp’s gross margin is 80%, they keep $0.80 of every dollar that comes in.
- Customer Churn Rate: This is the percentage of customers who cancel their subscriptions each month. If SyncUp loses 10 of its 500 customers in a month, its monthly churn rate is 2%.
Now, let's plug SyncUp's numbers into the formula:
- LTV = ($100 ARPA × 0.80 Gross Margin) / 0.02 Churn Rate
- LTV = $80 / 0.02
- LTV = $4,000
This result tells us that, on average, every new customer SyncUp brings on board is worth $4,000 in gross profit over their lifetime. If you want to go deeper on this, we have a complete guide on https://www.lowchurn.com/blog/how-to-calculate-customer-lifetime-value that explores the nuances.
Calculating Customer Acquisition Cost (CAC)
Customer Acquisition Cost (CAC) is exactly what it sounds like: the total cost to land one new customer. The trick to getting this right is to be brutally honest and include everything.
The formula is simple:
CAC = Total Sales & Marketing Spend / Number of New Customers Acquired
It’s vital to calculate this over a specific period, like a single month or quarter. Whatever period you choose, make sure it matches the timeframe you used for your churn rate to keep the comparison fair.
Let’s calculate CAC for SyncUp over the last quarter. Their expenses were:
- Ad Spend: $25,000
- Marketing & Sales Team Salaries: $45,000 (don't forget benefits and commissions!)
- Tool Subscriptions (CRM, Analytics, etc.): $5,000
- Content & Creative Costs: $5,000
SyncUp’s total sales and marketing spend for the quarter was $80,000. In that same period, they signed up 200 new customers.
- CAC = $80,000 / 200 New Customers
- CAC = $400
So, it costs SyncUp an average of $400 to acquire each new customer. One of the biggest challenges here is accurately assigning costs, which is where things like data-driven attribution models in GA4 become incredibly valuable.
Now for the moment of truth. With both LTV and CAC in hand, SyncUp can finally find its ratio:
- LTV:CAC Ratio = $4,000 / $400 = 10:1
A 10:1 ratio is phenomenal. It means for every $1 SyncUp spends on acquisition, it gets $10 back in lifetime value. That's the sign of a seriously efficient and scalable business.
What's a Good LTV:CAC Ratio in the Real World?
While you'll hear the 3:1 ratio thrown around as the gold standard, the truth is, a "good" LTV:CAC ratio isn't a one-size-fits-all number. The ideal target for your business depends entirely on who you sell to, your sales cycle, and the market you're in. Context is king.
Think about it: a high-touch B2B enterprise company with a long, costly sales process can't possibly use the same benchmark as a high-volume, self-serve B2C subscription app. The enterprise player needs a much higher ratio to justify the massive upfront investment in landing each customer.
Why Your Business Model Dictates Your Target Ratio
Your go-to-market strategy has a huge impact on your target LTV to CAC ratio. A B2B enterprise SaaS company, for instance, might aim for a muscular 5:1 or even 6:1 ratio. Their sales process is expensive—it involves demos, contract negotiations, and dedicated account executives, pushing their CAC into the thousands. For that math to work, the lifetime value needs to be astronomical, usually driven by multi-year contracts and major expansion revenue.
On the flip side, a B2C subscription app targeting a broad audience can do just fine with a 3:1 ratio. Their acquisition channels are usually lower-cost digital ads or organic content, and their game is all about acquiring customers at scale and keeping them from canceling. To see just how much churn can impact different business models, check out our guide on SaaS churn rate benchmarks.
An LTV:CAC ratio is only meaningful when you compare it against your specific business model and market. A 4:1 ratio could be phenomenal for one company but a sign of under-investment for another.
The Rising Cost of Winning Customers
Hitting a healthy LTV:CAC ratio has gotten a lot tougher recently, and there's one simple reason: customer acquisition is more expensive than ever. While SaaS companies worldwide still chase that 3:1 north star—a benchmark that became investor gospel after 2020—the goalposts have moved.
One analysis documented a staggering 222% surge in CAC over just eight years. To put that in perspective, the average cost to get a customer through Facebook ads in the US shot up from $0.97 to $3.50. As you can see from these findings on LTV vs CAC on data-mania.com, efficiency is no longer a "nice-to-have." This trend forces companies to get smarter about both sides of the equation—not just acquiring customers more efficiently, but also getting more value from the ones they already have.
SaaS LTV CAC Benchmarks by Business Model
To help you set more practical goals, it helps to see how these benchmarks shake out across different SaaS models. Each model has its own financial DNA, from acquisition costs to the main levers that drive lifetime value.
The table below gives you a snapshot of what "good" looks like for different kinds of SaaS companies, so you can align your targets with what's actually happening in your corner of the industry.
| SaaS Model | Ideal LTV CAC Ratio | Typical CAC Range | Primary LTV Driver |
|---|---|---|---|
| Enterprise B2B | 4:1 to 6:1 | $1,000 - $15,000+ | Expansion Revenue (Upsells/Cross-sells) |
| SMB B2B | 3:1 to 5:1 | $200 - $1,000 | High Retention and Product Stickiness |
| B2C Subscription | 2.5:1 to 4:1 | $50 - $300 | Volume and Low Churn |
At the end of the day, understanding these benchmarks is your first step toward building a smarter growth strategy. It lets you move past a single "golden ratio" and set targets that truly reflect your place in the market. That’s how you start measuring what actually matters for long-term, sustainable success.
Common Mistakes to Avoid When Analyzing Your Ratio
Getting your LTV:CAC ratio wrong can lead to disastrous business decisions. It can make a seemingly solid growth strategy feel like a fast track to burning cash. Calculating the numbers is just the start; the real magic happens when you analyze them with a critical eye. To make smart, informed decisions that actually protect your bottom line, you have to sidestep the common data traps.
Many founders fall into these traps not because their math is wrong, but because of hidden assumptions buried in their data. Let's dig into the strategic blunders that can mislead even the most experienced leaders.
Overlooking the Hidden Costs in CAC
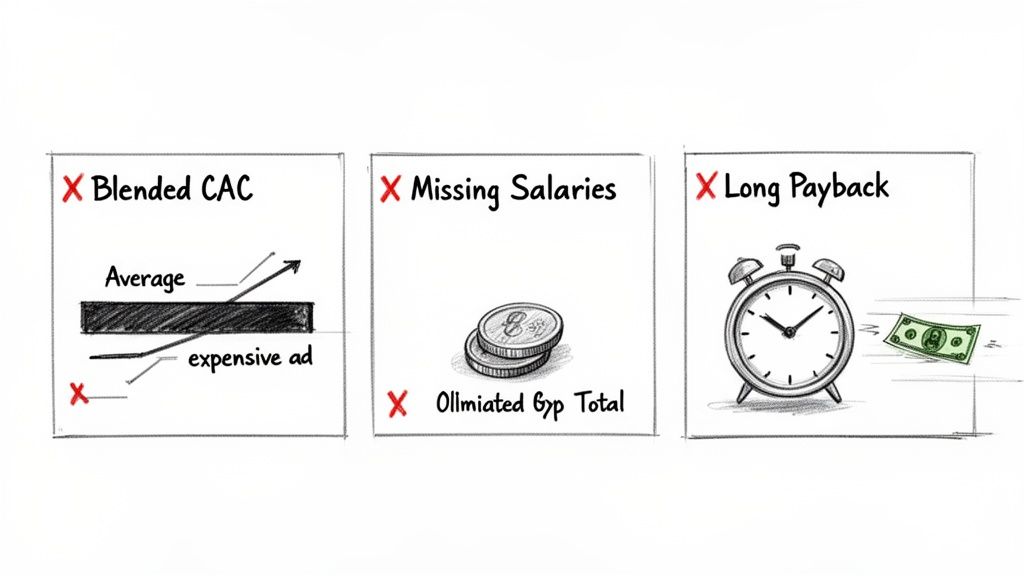
One of the most frequent mistakes I see is calculating an incomplete Customer Acquisition Cost. It’s easy to just count the obvious stuff like ad spend, but a true CAC includes every single cost that goes into winning a new customer.
This means you absolutely have to factor in:
- Team Salaries and Benefits for your entire sales and marketing departments.
- Tool Subscriptions like your CRM, marketing automation platforms, and analytics software.
- Creative and Content Costs, including any freelancers, agency fees, or production expenses.
Forgetting these costs artificially deflates your CAC, making your LTV:CAC ratio look much healthier than it is. This creates a dangerous false sense of security and can lead you to pour money into unprofitable channels.
Relying on a Blended CAC
Another major pitfall is using a "blended" CAC that lumps all your marketing channels together. Sure, it's simple to calculate, but it completely masks the performance of individual campaigns and can hide enormous inefficiencies. A blended CAC gives you a single number, but it tells you nothing about which channels are your growth engines and which are just draining your budget.
Cautionary Tale: A B2B SaaS company I know was celebrating a healthy 3.5:1 blended ratio. But when they finally segmented their CAC, they discovered their SEO efforts delivered a phenomenal 8:1 ratio, while a single expensive ad campaign was operating at a disastrous 0.75:1. The blended average hid the fact that one channel was actively losing them money on every new customer.
This is exactly why a channel-specific analysis is non-negotiable. You have to understand the LTV:CAC for each distinct acquisition source to properly allocate your marketing budget and scale what actually works.
Ignoring the Customer Payback Period
Finally, a fantastic ratio means very little if it takes forever to recoup your initial investment. The payback period is the time it takes for a customer to generate enough revenue to cover their acquisition cost. Ignoring this metric is a critical error because it directly impacts your cash flow.
A business could have an impressive 7:1 ratio, but if its payback period is 24 months, the company has to finance that customer for two full years before seeing a dime of profit. For startups and growing businesses, this is a cash flow nightmare, tying up capital that could be used for growth.
The goal for most SaaS businesses is to get that payback period under 12 months. Looking at your LTV:CAC ratio alongside your payback period gives you the full picture—not just of your profitability, but of your capital efficiency. It ensures your growth is not only sustainable but also financially viable in the short term.
Actionable Strategies to Improve Your LTV:CAC Ratio
Knowing your LTV:CAC ratio is a solid first step, but the real magic happens when you start improving it. Think of your ratio as a classic balance scale. To tip it in your favor, you can either add more weight to the LTV side or take some off the CAC side. The best companies do both.
This is where we move from theory to a practical playbook. Let's break down the proven tactics for both core missions: pushing customer lifetime value higher and systematically driving acquisition costs down. Pulling these levers is how you directly impact your profitability and build a business that lasts.
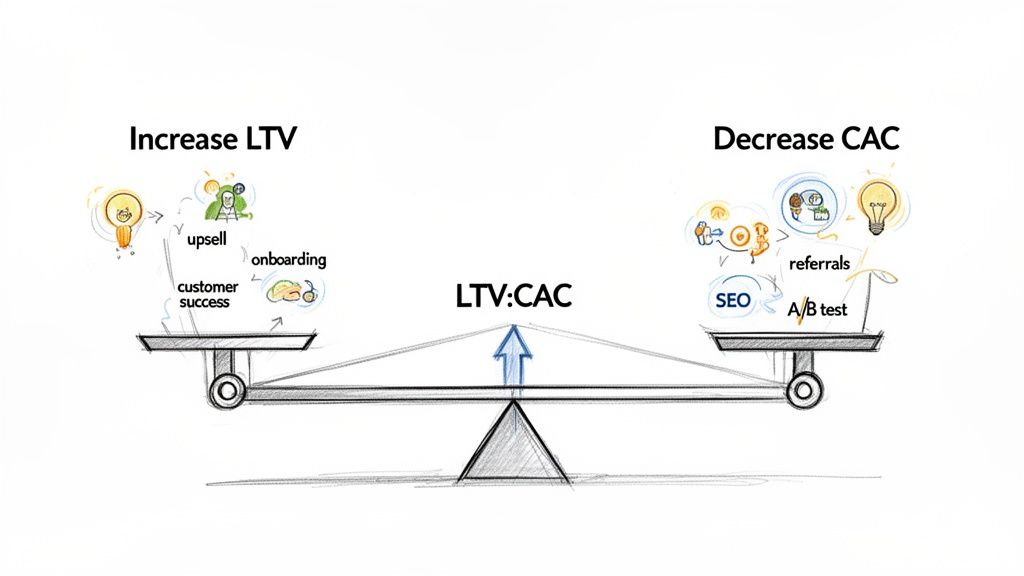
Mission 1: Boost Your Customer Lifetime Value
Increasing LTV is all about making your product so valuable that customers stick around longer and are happy to spend more over time. It’s the art of turning a single sale into a lasting partnership.
The most powerful strategies here boil down to two things: retention and expansion. Across the SaaS world, a healthy 3:1 to 4:1 ratio has long been the gold standard for profitable growth. A huge piece of that puzzle is simply keeping customers happy—strong retention alone can boost LTV by a whopping 22%.
Here are three powerful ways to get your LTV moving in the right direction:
Optimize Your Pricing Tiers: Your pricing isn't just a number—it’s a growth engine. When you structure tiers that align with the value customers get, you create a natural upgrade path as their needs expand. For instance, a project management tool might offer a "Pro" tier with advanced reporting, giving growing teams a compelling reason to move up from the basic plan.
- Key Metric to Track: Expansion MRR (Monthly Recurring Revenue). Seeing this number climb means your existing customers are finding more value and spending more.
Refine Customer Onboarding: Those first few weeks are make-or-break. A clunky or confusing onboarding experience is one of the biggest reasons for early churn. You need a streamlined process that gets users to their "aha!" moment fast, making your product essential from day one. Think of a SaaS tool that uses interactive tutorials to help users successfully launch their first project in minutes.
- Key Metric to Track: 30-Day Churn Rate. If this number is low and getting lower, your onboarding is working.
Build a Proactive Customer Success Program: Don’t just sit back and wait for support tickets to roll in. Proactive customer success means reaching out with helpful tips, checking in on their progress, and spotting expansion opportunities before they even think to ask. This builds incredible loyalty and shifts your relationship from a simple vendor to a true partner. For a deeper look, check out our guide on improving customer lifetime value for more advanced tactics.
- Key Metric to Track: Net Promoter Score (NPS) and Customer Health Score.
Mission 2: Systematically Lower Your Customer Acquisition Cost
While boosting LTV adds value on the backend, lowering CAC makes your entire growth engine more efficient. This isn't about slashing budgets indiscriminately; it’s about spending smarter to attract the right customers who will stick around.
Every dollar you save on acquisition is a dollar you can reinvest into your product or your team. The goal is to discover sustainable, cost-effective channels that consistently deliver high-quality customers.
A lower CAC means a shorter payback period, which frees up cash flow and lets you scale faster. It’s the key to making your growth not just possible, but profitable.
Here are three high-impact strategies to get your CAC under control:
Shift Budget to High-ROI Channels: Let's be honest, not all marketing channels are created equal. Paid ads can bring quick wins, but they're often expensive and the results stop the second you turn off the spend. Reallocating even a portion of that budget to organic channels like SEO and content marketing can dramatically lower your average CAC over time. It's a longer game, but a single great blog post can bring in new customers for years to come.
- Key Metric to Track: CAC by Channel. This data is gold—it shows you exactly which channels are your most efficient growth drivers.
Launch a Customer Referral Program: Your happiest customers are your most effective salespeople. A well-designed referral program gives them a real incentive to spread the word, bringing in new customers who already trust your brand because of the recommendation. Dropbox famously fueled its explosive growth by offering free storage to users who referred friends—a brilliant, low-cost acquisition strategy.
- Key Metric to Track: Viral Coefficient. This tells you how many new customers each existing customer brings in.
A/B Test Your Landing Pages: You'd be amazed at how small tweaks to your landing pages can have a massive impact on conversion rates. Systematically testing elements like headlines, calls-to-action (CTAs), and images helps you dial in the formula that converts the most visitors. Just think: improving your conversion rate from 2% to 3% effectively cuts your CAC by a third, without spending a single extra dollar on ads.
- Key Metric to Track: Lead-to-Customer Conversion Rate.
Answering Your LTV:CAC Questions
Even with the formulas laid out, the LTV:CAC ratio isn't always cut and dried. It’s a metric with real-world nuances that shift depending on your company's age, industry, and goals. Let's tackle some of the most common questions that pop up.
Think of this as your go-to reference for clearing up those lingering gray areas so you can put this knowledge to work with confidence.
What’s a Good LTV:CAC Ratio for an Early-Stage Startup?
When you're just starting out, the story you're telling with your numbers matters more than hitting a perfect 3:1 ratio out of the gate. Your first priority is acquiring those initial users and proving your product has legs, which means your acquisition costs are almost always going to be sky-high.
Honestly, a ratio of 1:1—or even a little less—is perfectly fine for a short time while you’re hunting for product-market fit. What investors really want to see is a clear path forward and proof that you’re moving in the right direction.
For a young company, the key isn’t perfection; it’s momentum. Showing you can move your LTV:CAC from 1:1 to 2:1 over a few quarters sends a powerful signal that your business model is getting smarter and more sustainable as you grow.
How Often Should I Calculate My LTV:CAC Ratio?
The golden rule here is consistency over frequency, but a quarterly check-in is the sweet spot for most SaaS businesses. This schedule is long enough to iron out any weird monthly blips but still frequent enough to spot important trends and make course corrections before it's too late.
Of course, your business model might call for a different rhythm:
- B2C Subscription Models: If you have short sales cycles and lots of customers, you might benefit from monthly calculations. This lets you tweak marketing campaigns on the fly and react quickly to performance data.
- Enterprise SaaS Models: For businesses with long, complex sales funnels, a quarterly or even semi-annual review makes more sense. Monthly data can be too noisy and misleading when a single deal can take six months to close.
The bottom line? Pick a cadence you can actually stick to. That consistency is what will give you a true read on your performance and show you if the changes you're making are actually working.
How Does the Payback Period Relate to the LTV:CAC Ratio?
The payback period is the trusty sidekick to your LTV:CAC ratio. It answers a simple but vital question: How many months does it take to earn back what you spent to acquire a customer? A great ratio doesn't mean much if it takes you years to get back into the black on each customer, because that just torches your cash flow.
Let's look at two companies, both with a solid 4:1 ratio.
- Company A has a 6-month payback period. They get their money back fast, which means they can immediately reinvest that capital into more growth.
- Company B has a 24-month payback period. While they're still profitable on paper, they have to float the cost of each customer for two full years before they see a dime of profit.
Looking at these two metrics together gives you the full story of your financial engine's efficiency. The gold standard for a scalable SaaS business is a high LTV:CAC ratio paired with a short payback period—ideally under 12 months.
Can My LTV:CAC Ratio Be Too High?
It sounds crazy, but yes. A ratio that's consistently way up there—think 5:1 or higher—can actually be a warning sign. While it looks fantastic on a spreadsheet and signals incredible customer-level profitability, it usually means one thing: you're not investing enough in sales and marketing.
An extremely high ratio is a sign that your acquisition engine is incredibly efficient, but you're not putting enough fuel in the tank to see how fast it can really go. This conservative approach is risky because it leaves a wide-open lane for a more aggressive competitor to come in and eat your lunch.
If your ratio is floating above 5:1, don't just pat yourself on the back. Instead, ask a strategic question: "Where can we intelligently spend more to grow faster?" It’s a clear signal that you have a huge opportunity to scale your acquisition efforts.
Ready to improve your LTV by proactively reducing churn? LowChurn uses AI to predict which customers are at risk of canceling and gives you the tools to save them. Get started in under a minute and protect your MRR.