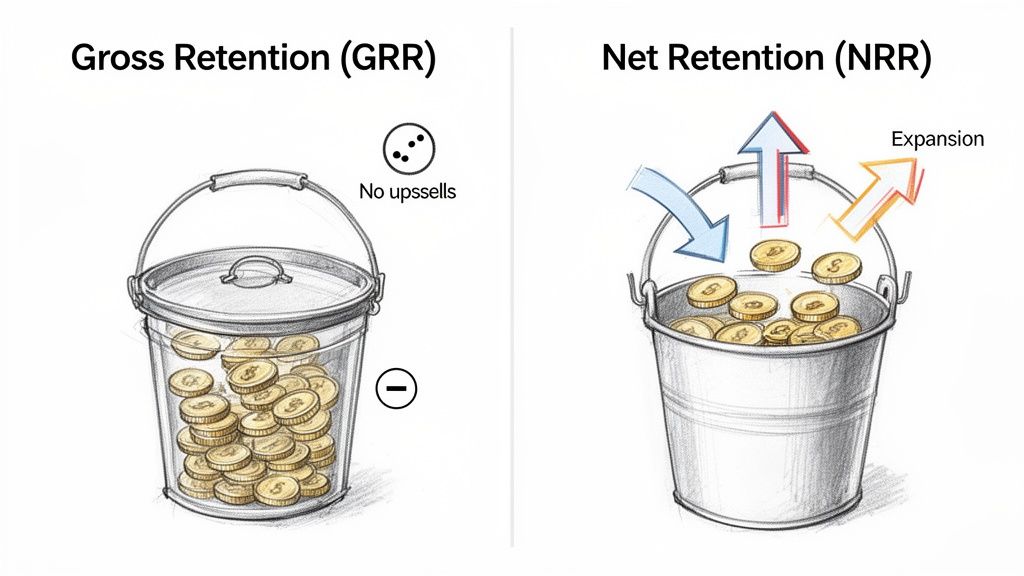
The key difference between these two metrics is what they choose to ignore. Gross Revenue Retention (GRR) focuses solely on your ability to hold onto the revenue you already have from your current customers. It intentionally leaves out any new money from upsells. On the flip side, Net Revenue Retention (NRR) includes that expansion revenue, giving you a picture of your overall account growth and efficiency.
Understanding The Difference Between Gross And Net Retention
When you're trying to get a real handle on the health of your SaaS business, GRR and NRR are two sides of the same coin. They work together to give you a layered view of customer loyalty and growth, helping you understand both your product's fundamental value and your team's ability to grow those customer relationships over time.
Think of GRR as the purest measure of product stickiness. Because it’s capped at 100%, it gives you a brutally honest look at how well you prevent revenue from leaking out through churn or downgrades. A high GRR is a great sign; it means your customer base is stable and consistently finds your service valuable.
NRR, however, tells a different story—it's all about the effectiveness of your growth engine. By factoring in expansion revenue from upsells and cross-sells, it reveals if the growth from your existing customers is strong enough to overcome the revenue you lose. When your NRR is over 100%, you've hit a magic milestone: your business can grow even without adding a single new customer. To really get into the weeds on this, you can learn more about the net retention rate in our detailed guide.
Gross Retention tells you if your product is essential. Net Retention tells you if your business is efficient. Tracking both is non-negotiable for understanding the true health of your revenue.
To really nail down the distinction, let's look at a quick side-by-side comparison of their core components and what they're designed to do.
Gross Retention vs Net Retention at a Glance
Here’s a simple table to help you keep these two crucial metrics straight.
| Metric | What It Measures | Includes Revenue From | Primary Business Question | Ideal State |
|---|---|---|---|---|
| Gross Retention (GRR) | Revenue preservation from existing customers. | Starting recurring revenue minus churn and downgrades. | "Are we keeping the revenue we already have?" | As close to 100% as possible. |
| Net Retention (NRR) | Overall revenue growth from the existing customer base. | GRR plus expansion, upsells, and cross-sells. | "Is our existing customer base a source of growth?" | Over 100% (often 120%+ for top-tier SaaS). |
This at-a-glance view makes it clear: GRR is your defense, and NRR is your offense. You need both to win.
Calculating Retention Metrics With Real-World Examples
The theory is great, but getting your hands dirty with the numbers is where you really start to understand your business. Let's walk through the math for both gross and net retention using a simple, practical scenario. This will show you just how differently these two metrics can tell the story of your company's health.
Picture a SaaS company, "Innovate Inc." At the start of the month, they have a solid $100,000 in Monthly Recurring Revenue (MRR). Over the next 30 days, some things change with their existing customers.
The Gross Retention Rate Formula
First up is Gross Retention Rate (GRR). Think of this as your pure retention power—it measures how well you hold onto the revenue you already have, completely ignoring any upsells or expansion. It's all about preservation.
GRR = (Starting MRR - Churn MRR - Contraction MRR) / Starting MRR
Let’s say Innovate Inc. lost $5,000 in MRR from customers who canceled their subscriptions entirely (that's your churn). They also lost another $2,000 from customers who downgraded to a cheaper plan (contraction).
Now, let's plug those numbers into the formula:
- Calculation: ($100,000 - $5,000 - $2,000) / $100,000
- Result: $93,000 / $100,000 = 93% GRR
A 93% GRR is a strong signal. It tells you that Innovate Inc. held onto 93 cents of every dollar they started with. This gives you a clean, honest baseline for your product's stickiness.
The Net Retention Rate Formula
Now for the other side of the coin: Net Retention Rate (NRR). This metric tells a broader story by including expansion revenue, showing the growth momentum within your existing customer base. It builds directly off the GRR formula.
NRR = (Starting MRR - Churn MRR - Contraction MRR + Expansion MRR) / Starting MRR
On top of the churn and contraction we already know about, let's say Innovate Inc.'s team did a great job upselling. They generated an additional $15,000 in expansion MRR from existing customers who upgraded plans or bought add-ons.
Here's how that changes the math:
- Calculation: ($100,000 - $5,000 - $2,000 + $15,000) / $100,000
- Result: $108,000 / $100,000 = 108% NRR
An NRR over 100% is what every SaaS founder dreams of. This 108% NRR means that even after losing some revenue, Innovate Inc. more than made up for it through growth from their loyal customers. For every dollar they had, they turned it into $1.08 by the end of the month. If you want to explore this further, check out our guide on how to calculate your customer retention ratio.
This example perfectly frames the gross vs. net retention debate. The 93% GRR shows the product is valuable and stable, but the 108% NRR proves the company is a master at growing accounts over time.
This isn't just a hypothetical, either. It’s a common pattern. You might see a customer cohort start at $770 MRR, and a year later, that same cohort is only worth $630 from a gross perspective (81.8% GRR). But once you factor in upsells, the NRR could easily be much higher, painting a much healthier picture of the full customer journey. For more on this, check out the fantastic SaaS retention benchmarks on ChartMogul.
What Your Retention Metrics Are Actually Telling You
Running the numbers on gross and net retention is just the start. The real magic happens when you interpret what they're saying about your business. The dynamic between GRR and NRR tells a story—a strategic narrative that highlights where you’re winning and, more importantly, where you're bleeding. Looking at them together lets you move past simple reporting and start making smarter decisions that will shape your company's future.
This decision tree gives you a great visual for the core difference between the two metrics. You can see exactly how expansion revenue creates that fork in the road, separating GRR from NRR.
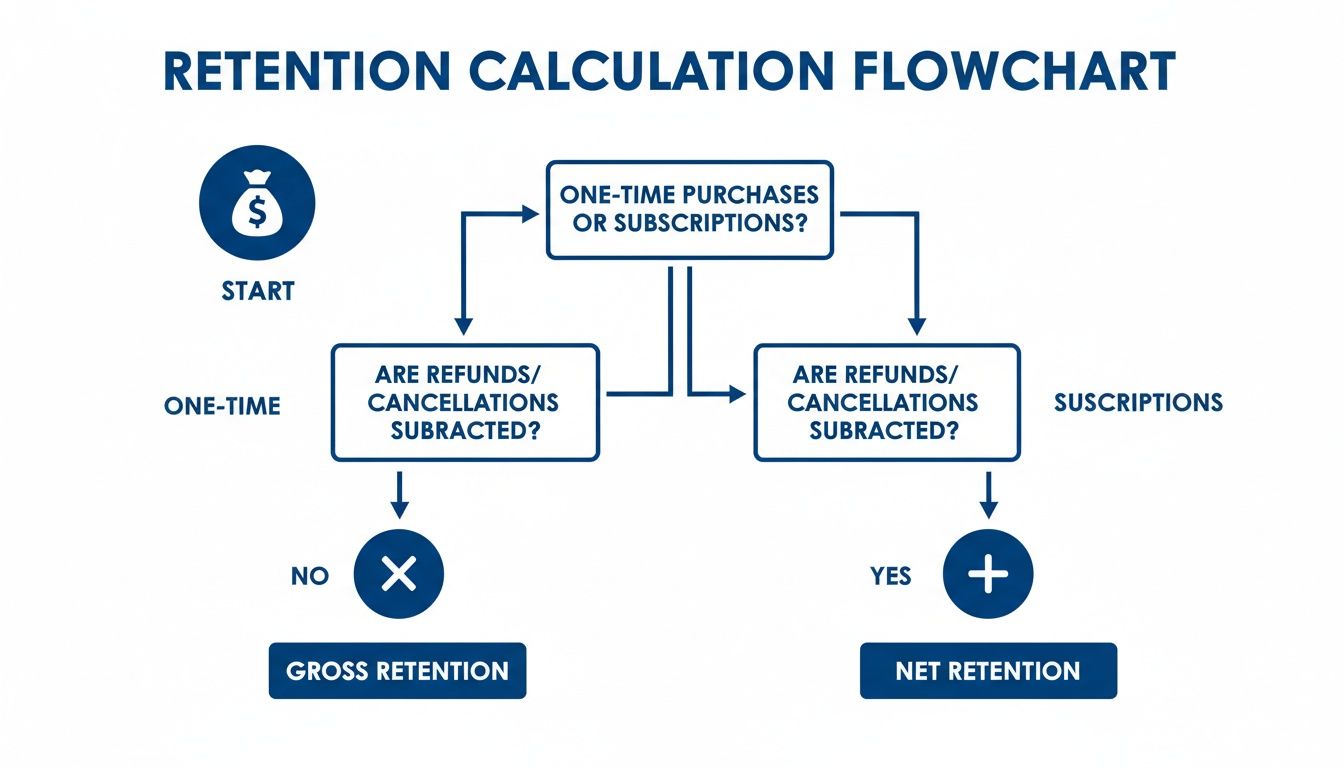
As the flowchart shows, both calculations begin with the same pool of recurring revenue. It's the inclusion of upgrades and cross-sells that makes NRR a true measure of growth.
Diagnosing Your Business Health
Let’s walk through four common scenarios. Each pairing of high or low GRR and NRR paints a very different picture of your company's health and tells you which strategic questions you need to ask right now.
1. High GRR & High NRR: The Ideal Growth Engine This is the holy grail for any SaaS business. A high GRR proves your product is sticky and that customers are getting real value, which keeps churn and downgrades to a minimum. When you layer a high NRR on top of that, it shows your customer success and product teams are absolute pros at driving expansion revenue.
Your business isn't just holding onto customers; it’s turning them into your most powerful growth channel. You've built a stable, predictable revenue base that is actively growing all by itself.
2. High GRR & Low NRR: A Sticky Product Lacking Expansion In this situation, customers clearly like your product enough to stay. That's a huge win. Your healthy GRR is a strong signal of product-market fit and tells you that customers aren't looking for the exit.
The problem? A low NRR points to a major missed opportunity. You're great at defending your revenue, but you're not growing it from within your existing customer base. This could be a sign that your pricing tiers are poorly structured, you don't have compelling upgrade paths, or your team simply isn't focused on finding expansion opportunities.
A high GRR with a low NRR means you're sitting on a loyal customer base that you aren't monetizing effectively. The strategic question is: Where are the untapped expansion opportunities within our happy customers?
3. Low GRR & High NRR: The Leaky Bucket Propped Up by Upsells This one is tricky and incredibly dangerous. A high NRR can look fantastic on a dashboard, tricking you into thinking growth is strong. But the low GRR lurking underneath reveals a fundamental problem: you're churning customers at an unsustainable rate.
You're essentially using your biggest and best customers to paper over the cracks of a serious churn problem. This isn't a sustainable model. Your teams are stuck in a constant battle, desperately upselling your happiest accounts just to replace the revenue pouring out from everyone else. This puts immense pressure on your success and sales teams and makes your revenue base fragile.
4. Low GRR & Low NRR: The Critical Danger Zone This is a five-alarm fire. A low GRR means customers are leaving in droves, and a low NRR confirms you have zero expansion revenue to offset those losses. Your business is shrinking from the inside out.
This scenario points to a massive disconnect with your product, your onboarding process, or your core value proposition. You need to take immediate, drastic action to figure out why customers are churning and why there's no path to growth before the situation becomes irreversible.
SaaS Retention Benchmarks: What Does "Good" Look Like?
Knowing your gross and net retention numbers is the first step. The real question is, are they any good? While every SaaS is different, looking at industry benchmarks gives you a critical yardstick to measure your performance and set goals that are both ambitious and grounded in reality.
What's considered "good" isn't a single, universal number. It really boils down to who you're selling to.
The difference between serving small-to-midsize businesses (SMBs) and large enterprises creates two completely different retention stories. Enterprise clients, with their big contracts and deep-seated reliance on your product, just don't churn as often. The SMB world, on the other hand, is much more fluid, which naturally leads to lower baseline retention rates.
Gross Retention Rate Benchmarks
Gross Revenue Retention (GRR) is all about pure customer stickiness, leaving expansion revenue out of the picture. Think of it as your foundation.
- 95%+ (Excellent): This is elite territory, signaling a product that's incredibly difficult to replace. You almost exclusively see this with enterprise-focused SaaS.
- 90% (Gold Standard): For most B2B SaaS companies, hitting 90% is a sign of a healthy, sustainable business. It's a great target to aim for.
- Below 85% (Warning Zone): If your GRR drops below this mark, it’s often a red flag. You likely have a churn problem that needs to be addressed immediately.
Net Retention Rate Benchmarks
Net Revenue Retention (NRR) tells a different story—one of growth from within your existing customer base. Since it factors in expansion revenue, the best companies often soar past the 100% mark. For companies selling to the enterprise, an NRR of 120% or higher is often the goal, proving they have a powerful engine for upselling and cross-selling.
Recent 2023 data puts the median NRR for the SaaS industry right around 102%. But again, the benchmarks split when you look at who the customer is. A solid GRR is typically 90% or more (though it might be closer to 80% for SMB-focused businesses), and it can't go above 100%. NRR is where that growth potential shines through. You can dive deeper into the numbers by checking out more SaaS retention benchmarks on Growth Equity Interview Guide to see how these figures shift.
The real magic happens when your existing customers not only stick around but also spend more over time. A GRR above 90% gives you a stable foundation, while an NRR over 110% proves you have a growth model that can truly scale.
At the end of the day, these benchmarks are more than just numbers—they're strategic tools. They give you the context to understand your own performance, pinpoint where you’re falling behind, and define what top-tier success actually looks like in your corner of the market. This is what helps a team move from simply tracking metrics to actively driving real, sustainable growth.
Why Gross Retention Matters Most In A Downturn
In a healthy market, everyone loves to talk about Net Revenue Retention (NRR). It’s easy to see why. An NRR over **100%** tells a compelling story to investors—it signals a company that can grow its revenue even without signing a single new customer. But when the economic climate shifts and uncertainty creeps in, the spotlight swings dramatically to Gross Revenue Retention (GRR).During a downturn, GRR becomes the ultimate stress test for your business. It ruthlessly strips away the comforting buffer of expansion revenue and reveals the raw, unfiltered loyalty of your customer base. Think of a high GRR as your "retention moat"—a stable foundation of recurring revenue that defends your business when budgets for new software and account upgrades are the first things on the chopping block.
The Vulnerability of an Expansion-Reliant Model
Companies that lean heavily on expansion revenue to hit a high NRR are often walking a tightrope. Their impressive growth numbers can easily hide a leaky bucket, where high churn is constantly being patched over with aggressive upselling and cross-selling. This model isn't just fragile; it's a liability in a downturn.
When customers start tightening their belts, expansion revenue is no longer a given. It's a luxury. Your core product, on the other hand, needs to be a necessity. A strong GRR is the proof that it is.
In an economic downturn, GRR isn't just a health metric; it's a survival metric. It measures the non-negotiable value your product delivers, which is the only thing that truly matters when customer budgets shrink.
This stability is what separates the resilient companies from those built on bull market hopes. A business with a 95% GRR has a predictable revenue floor, giving it the breathing room it needs to navigate uncertainty and plan for real, sustainable growth.
Building a Resilient Revenue Base
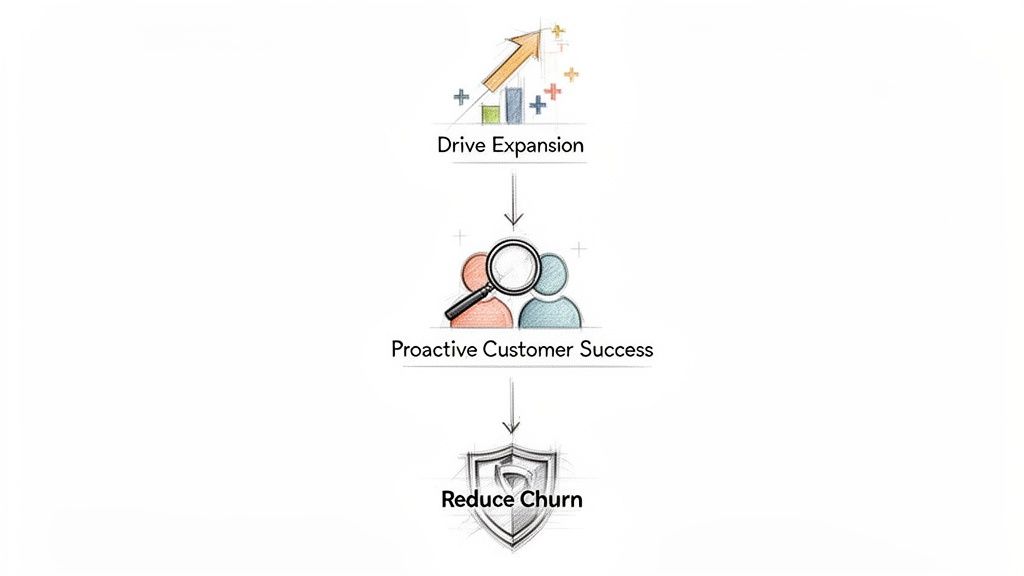
Focusing on GRR forces you to get the fundamentals right: exceptional onboarding, proactive customer success, and a product that flawlessly solves a core business problem. It’s about making your existing customers so successful that they can’t imagine running their business without you. This approach creates a powerful flywheel that pays dividends long after the market recovers.
Prioritizing this core health isn't just a defensive move; it's a strategic long-term play. When market headwinds hit, companies that have cultivated strong gross retention consistently prove more resilient. For example, a 2023 Software Equity Group analysis on retention showed that businesses prioritizing customer success to bolster GRR tend to outperform those relying on aggressive expansion strategies for long-term ARR growth.
At the end of the day, NRR tells you how fast you can grow when times are good. GRR tells you how well you can survive when they’re not. For founders building a company to last, that distinction means everything. A high GRR is the bedrock upon which all future growth—including healthy, sustainable expansion—is built.
How to Improve Your SaaS Retention Metrics
Knowing the difference between gross and net retention is the easy part. Actually improving them? That takes a real strategy. The best place to start is with a strong defense—protecting the revenue you already have to lift your Gross Revenue Retention (GRR). A high GRR is the foundation of healthy, sustainable growth.
Building that foundation means moving from a reactive support model to a proactive customer success mindset. You need to spot at-risk accounts before they're headed out the door. Platforms like LowChurn can help by analyzing product usage and subscription data to flag customers who are likely to cancel, giving your team a crucial heads-up to step in and help.
Automated retention campaigns are also incredibly effective. You can set up triggers for re-engagement emails or in-app messages based on specific user behaviors. This lets you tackle problems systematically and prove your product’s value at just the right moments.
Build Your Foundation, Then Expand
When you reduce churn and contraction, you directly strengthen your GRR. This creates a much more stable and predictable revenue engine. Once that core revenue is locked down, you've earned the right to shift your focus to expansion and your Net Revenue Retention (NRR).
A high, stable GRR provides the solid ground you need to build your NRR growth engine. You can't effectively upsell a customer base that's constantly at risk of churning.
With a happy, secure customer base, your team can finally stop fighting fires and start looking for genuine growth opportunities. They can confidently pursue strategic upsells and cross-sells. To get started, you can explore some actionable customer retention best practices designed for product-led SaaS companies.
This two-step process—secure first, then expand—is how you turn retention metrics into a powerful growth flywheel. Protecting your GRR ensures your bucket isn't leaky, while focusing on NRR fills that bucket faster. For a more detailed breakdown of what to do next, check out our complete guide on how to improve customer retention.
Common Questions About Retention Metrics
Even after you’ve got the formulas down, a few questions always seem to pop up when teams start digging into gross versus net retention. Let's clear up some of the most common points of confusion.
Can Gross Retention Exceed 100 Percent?
The simple answer is no. By its very nature, Gross Revenue Retention (GRR) maxes out at 100%. That’s because the metric is built to show one thing and one thing only: how well you hang onto the revenue you already have from a set group of customers.
It deliberately ignores all expansion revenue from upsells or cross-sells. The absolute best-case scenario is keeping every single customer and every single dollar from them—no churn, no downgrades. That perfect score is 100%, which is why GRR is such a pure measure of your product's stickiness.
Which Metric Do Investors Focus On More?
Investors look closely at both, but they’re searching for different clues. Net Revenue Retention (NRR) often steals the spotlight because it’s a powerful indicator of growth and efficiency. When NRR climbs over 100%, it sends a clear signal that the business can expand its revenue base without even signing up a single new customer. That gets people excited.
But a smart investor won't stop there. They'll immediately look at GRR to check the foundation. A high NRR can easily hide a leaky bucket—where you're losing lots of customers but making up for it with huge expansions from a few happy ones. That's a red flag.
A strong GRR proves the product has real staying power. A strong NRR proves the business model can scale. Investors need to see both to feel confident about the long-term health of the company.
How Often Should We Track These Metrics?
You should be looking at both GRR and NRR every month and every quarter. This cadence is frequent enough to help you spot trends as they emerge, see if your retention efforts are actually working, and make quick adjustments to your customer success strategy.
Beyond that, analyzing annual cohorts is crucial for understanding the big picture—things like long-term customer value and how user behavior changes over time.
Ready to stop guessing and start predicting churn? LowChurn uses AI to identify at-risk customers on Stripe, so you can act before they cancel. See how much MRR you can save at https://www.lowchurn.com.