Think of a predictive churn model as your business's early warning system. It digs through all your customer data—how they use your product, their subscription history, support tickets—to pinpoint which users are most likely to cancel their subscriptions. It’s about spotting trouble before it happens, giving you a chance to step in and save the account.
Your Early Warning System for Customer Churn
Customer churn isn't just a number on a dashboard; it's a silent killer for growth. For any SaaS founder, it feels like trying to fill a bucket with a hole in it. You're working hard to pour in new monthly recurring revenue (MRR), but a steady stream is leaking out the bottom.
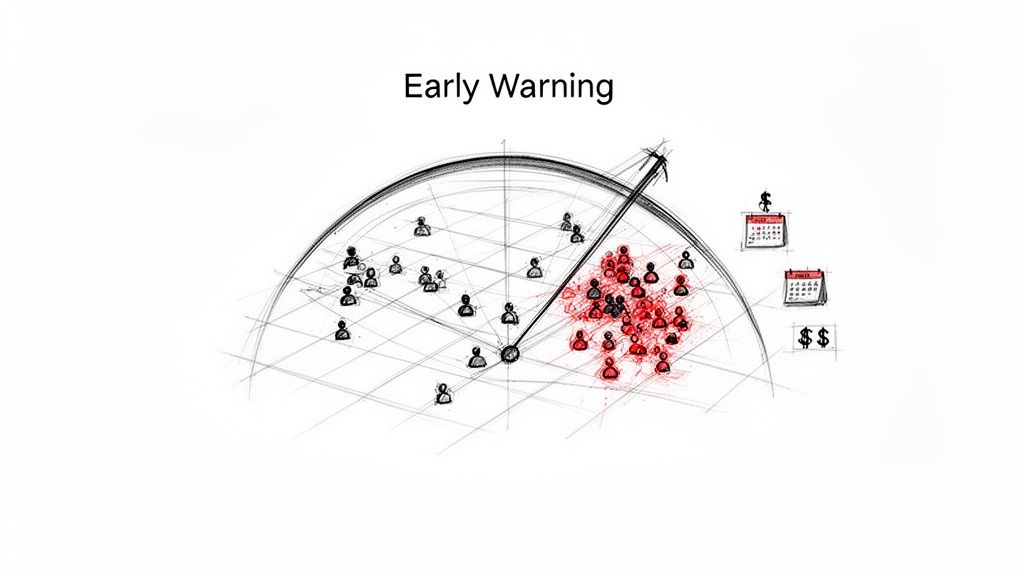
A predictive churn model flips the script, turning retention from a reactive guessing game into a proactive, data-driven strategy. It’s less like a post-mortem and more like a sophisticated weather radar for your business. Instead of just reacting to a storm of cancellations after it hits, this system helps you see the warning signs long before they turn into a crisis.
This foresight is a game-changer because it gives you the one thing you can't buy: time. You can spot at-risk customers weeks in advance, opening a crucial window for your team to act, re-engage them, and ultimately turn things around.
To get a clearer picture, let's break down the key components.
Predictive Churn Model At a Glance
This table provides a quick summary of the core components of a predictive churn model, outlining the inputs, process, and expected outputs.
| Component | Description | Example for a SaaS Business |
|---|---|---|
| Data Inputs | Raw information collected about customer behavior and account status. | Product usage logs (logins, feature clicks), subscription data from Stripe (plan changes, payment failures), support ticket history. |
| Model Processing | The machine learning algorithm analyzes patterns in the data to identify leading indicators of churn. | The model learns that a drop in weekly logins combined with a recent failed payment is a strong predictor of cancellation. |
| Actionable Outputs | The model generates a risk score or a probability of churn for each customer. | Customer A has an 85% churn risk; Customer B has a 12% risk. The customer success team is alerted to focus on Customer A. |
As you can see, the goal is to transform raw data into a clear, prioritized list of actions that can directly impact your bottom line.
Why Predicting Churn Is a Non-Negotiable Strategy
In a packed market, just waiting for customers to cancel is a losing strategy. The tough reality is that without intervention, a good chunk of your customer base is always at risk. For average customers, churn rates can climb as high as 70%, a wake-up call that underscores just how critical proactive retention is. You can see how data science teams are tackling this head-on in the full Klaviyo churn prediction report.
This means you can finally move beyond the anxiety of watching your MRR suddenly drop and scrambling to acquire expensive new customers to replace the ones you just lost. Instead of asking, "Why did they leave?" you can start asking, "Who is likely to leave, and what can we do about it right now?"
A successful predictive churn model isn't just about technical accuracy; it’s about providing actionable intelligence. It tells you where to focus your resources for the highest impact, turning your customer success team from firefighters into strategic growth drivers.
Ultimately, this approach puts you back in control of your revenue and helps build a more resilient subscription business. Once you understand the subtle behaviors that come before a cancellation, you can create targeted interventions that actually work.
These efforts could look like:
- Personalized outreach from a customer success manager to high-value accounts showing risk signals.
- Targeted educational content sent to users who have stopped using a key feature.
- Automated re-engagement campaigns triggered by specific risk scores from the model.
By shifting from hindsight to foresight, a predictive churn model becomes one of the most powerful tools in your growth arsenal. It’s your best defense against the silent drain of customer churn.
Gathering the Right Data to Predict Churn
A predictive churn model is only as good as the data you feed it. Think of it like cooking: even the world's best chef can't make a masterpiece with subpar ingredients. If you feed an algorithm messy, irrelevant, or incomplete data, you’ll get garbage predictions back. It's that simple.
To build a model that actually works, you need to collect signals that tell a coherent story about your customers. These signals fall into two main camps: how they’re using your product, and what’s happening with their subscription.
Product Engagement Signals
This is all about behavioral data—what are people actually doing inside your app? These are often the earliest and strongest whispers of churn. Why? Because a customer’s engagement level is a direct reflection of the value they're getting. When that value perception drops, their usage almost always follows suit before they hit the cancel button.
Here are the kinds of engagement signals you should be tracking:
- Login Frequency: Is that power user who logged in daily now only showing up once a week? That's a huge red flag. You'll want to track trends in login activity over the last 7, 14, and 30 days.
- Feature Adoption Rate: Every SaaS product has "sticky" features—the ones that correlate with long-term retention. Your model can learn that customers who never touch "Feature X" are 3x more likely to leave.
- Key Action Completion: Are users finishing the core workflows that deliver on your product's promise? For a project management tool, this could be "creating a new project" or "assigning a task." If they aren't, they're not getting value.
- Support Ticket Volume: A sudden flood of support tickets can signal a user is hitting roadblocks and getting frustrated. On the flip side, a complete silence from a previously active customer often points to quiet disengagement.
This kind of data gives you the real story behind a customer's journey. To get a better handle on this, our guide on how to measure customer engagement is a great place to start. It’s the bedrock of any solid churn model.
Subscription and Billing Signals
If engagement data tells you about intent, subscription data gives you the hard facts. This information, usually pulled straight from your payment processor like Stripe, points to concrete, account-level problems. These signals are less about predicting the future and more about identifying immediate fires that need putting out.
Look out for these billing signals:
- Failed Payments: A single failed payment might just be an expired credit card. But multiple failures in a row? That's a classic sign of impending involuntary churn.
- Subscription Downgrades: When a customer moves from a premium plan to a free or basic one, they're telling you they're less invested. This is often the last step before they cancel for good.
- Upcoming Renewal Dates: This is crunch time. Customers almost always re-evaluate a tool's ROI right before the next bill is due, making it a critical window for proactive outreach.
By blending rich product engagement data with these hard-and-fast transactional signals, your model gets smart enough to tell the difference between a customer who's just on vacation and one who's already mentally checked out.
The Power of Feature Engineering
Okay, so you've collected all this raw data. Now what? Just dumping it into a model won't get you very far. The real magic happens in a process called feature engineering.
This is where you transform raw data points into meaningful inputs—or "features"—that an algorithm can actually learn from.
Think of yourself as a translator. A model doesn't get what "logged in five times last week" means. But it can understand a feature you create called login_frequency_decline, where a value of 1 means the user's login rate dropped by 50% this month. You've just turned a simple log file entry into a powerful predictive signal.
Instead of just grabbing the last_login_date, you can engineer much smarter features:
- Days Since Last Login: Simple, classic, and surprisingly effective.
- Session Duration Trend: Is the average time they spend in your app going up or down?
- Ratio of Core Features Used: If you have 10 key features, what percentage has this user adopted in the last 30 days?
This is what separates a mediocre churn model from one that feels like a crystal ball. By thoughtfully crafting features that capture trends, ratios, and changes over time, you give your model the high-quality "ingredients" it needs to spot at-risk customers with incredible precision.
Choosing the Right Churn Prediction Model
Once your data is ready, it's time to pick the right predictive model to make sense of it all. This isn't as complex as it sounds; you don't need a data science PhD to grasp the options. Think of these models as different tools in a workshop—each one is built for a specific job and comes with its own set of strengths and weaknesses.
The trick is to start with a tool that fits your current needs and the data you have on hand. You can always level up to something more powerful later. Let's walk through the most common approaches, from the reliable workhorse to the high-performance specialist.
The decision tree below gives you a sense of how a model sifts through different signals—like product engagement and billing events—to arrive at a churn prediction.
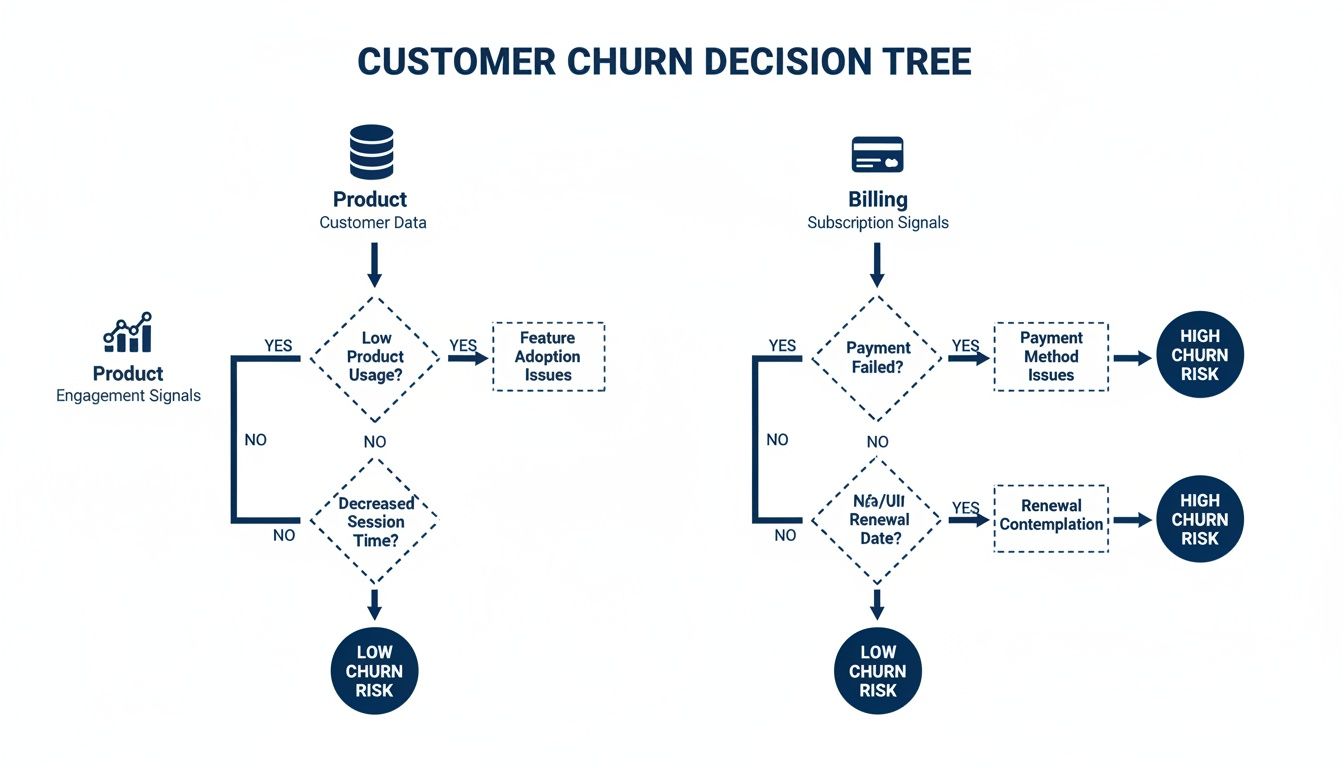
As you can see, a solid model looks at both how a customer uses your product and the health of their subscription to make an informed prediction.
Logistic Regression: The Dependable Starting Point
For most SaaS teams, Logistic Regression is the perfect place to start. It’s a classic statistical method that calculates the probability of one of two outcomes happening. In our case, will a customer churn (yes) or not (no)?
It's fast, relatively simple to set up, and doesn't require a mountain of data to deliver meaningful results.
Its biggest selling point is transparency. The model clearly shows which factors—like a drop in logins or a failed payment—are pushing the churn prediction up or down. This makes it incredibly easy to explain the "why" behind the numbers to your team and other stakeholders.
Tree-Based Models: Uncovering Complex Patterns
When you need to dig deeper and find more subtle patterns in your data, Tree-Based Models like Random Forest or Gradient Boosting are the next logical step. Think of these models as a team of detectives, each one following a different lead to figure out which customers are likely to leave.
A single decision tree works by asking a series of "if-then" questions to segment customers. A Random Forest model takes this a step further, building hundreds of these trees and then averaging their predictions. This ensemble approach makes the model far more accurate and robust.
Survival Analysis: Predicting When Churn Happens
While other models predict if a customer will churn, Survival Analysis answers a different, equally critical question: when are they most likely to do it? This technique, which has its roots in medical research for predicting patient outcomes, is a fantastic fit for subscription businesses.
Instead of just spitting out a simple "at-risk" score, it produces a survival curve for each customer, showing their churn probability over time. This is a game-changer for timing your retention efforts. For instance, you might discover that your highest-risk accounts are most likely to cancel between day 60 and day 90.
Survival analysis lets you move from generic outreach to perfectly timed interventions. You can design retention campaigns that engage customers during their most critical decision-making windows, dramatically increasing your chances of success.
Deep Learning: The Powerhouse for Massive Scale
Finally, we have Deep Learning. These models, which use neural networks inspired by the human brain, are the most powerful tool in the shed. They can sift through enormous, complex datasets to find patterns that are invisible to every other method.
But all that power comes with a hefty price tag. Deep learning models demand huge amounts of data, serious computing power, and specialized expertise to build and maintain. For most SaaS companies, it’s frankly overkill. But for enterprise-level businesses with millions of users, they can offer a real competitive edge.
Selecting the right modeling technique is a foundational step in building effective predictive analytics for customer retention.
Comparison of Predictive Churn Modeling Techniques
To make the choice clearer, here’s a quick breakdown of how these different modeling approaches stack up against each other. Each has a sweet spot depending on your data, your team's skills, and your business goals.
| Modeling Technique | Best For | Key Advantage | Main Limitation |
|---|---|---|---|
| Logistic Regression | Teams just starting with churn prediction; prioritizing interpretability. | Simple, fast, and highly explainable ("white box"). | May miss complex, non-linear patterns in customer behavior. |
| Tree-Based Models | SaaS companies with clean data looking for higher predictive accuracy. | Excellent at capturing nuanced interactions between different signals. | Can be harder to interpret; sometimes feels like a "black box." |
| Survival Analysis | Businesses that need to know when to intervene, not just if. | Predicts the timing of churn, enabling proactive outreach. | More complex to set up and interpret than binary models. |
| Deep Learning | Enterprise-scale companies with massive datasets and data science teams. | Unmatched power for finding hidden patterns in huge, complex data. | Requires immense data, computing resources, and expertise. |
Ultimately, the best model is the one that gives you actionable insights you can trust. Don't be afraid to start simple with logistic regression and evolve your approach as your team and data mature.
How to Measure Your Model's Real World Impact
So, you’ve built a predictive churn model. That’s a huge step. But how do you actually know if it's any good? It's a critical question, and the most common answer—"accuracy"—is a trap.
Let's say your monthly churn rate is 3%. That means a whopping 97% of your customers stick around. A lazy model could simply predict that no one will churn and still be 97% accurate. It’s a perfect score on paper, but completely useless in reality. It doesn't find a single at-risk customer.
To figure out what your model is really worth, we need to go deeper than surface-level accuracy. We need metrics that show us how well it separates the customers who are heading for the door from those who are happy—and how that translates into saved revenue.
Gauging Predictive Power with ROC and AUC
The first place to look is the Receiver Operating Characteristic (ROC) curve and its sidekick, the Area Under the Curve (AUC) score. Think of AUC as a simple report card for your model, graded on a scale from 0 to 1.
An AUC of 0.5 is a failing grade; it’s no better than flipping a coin. An AUC of 1.0 is a perfect score, meaning the model can flawlessly tell the difference between a future churner and a loyal customer. In the real world, a good churn model typically lands somewhere between 0.75 and 0.90.
This single number gives you a solid, high-level sense of your model's predictive muscle. It tells you how well it can correctly rank a random at-risk customer higher than a random healthy one. It’s the first gut check to see if your model is actually learning anything useful.
The Balancing Act: Precision vs. Recall
While AUC gives you the big picture, Precision and Recall are where you start fine-tuning the model for your team. They help you answer two very different, but equally crucial, business questions.
- Precision: Out of all the customers we flagged as "at-risk," how many actually churned? High precision means you’re not sending your customer success team on wild goose chases after happy customers.
- Recall: Out of all the customers who did churn, how many did our model catch? High recall means you’re casting a wide net and not letting at-risk accounts slip through the cracks unnoticed.
You can’t have your cake and eat it too; there’s always a trade-off. Tuning for sky-high precision often means you’ll miss a few churners (lower recall). Cranking up recall to catch everyone usually means you’ll flag more healthy customers by mistake (lower precision). The right balance comes down to your retention strategy and, frankly, how much time your team has.
The goal isn't just to get high scores on a dashboard. It's about building a model that fits your team's capacity. A model spitting out 500 hyper-precise alerts is worthless if your CSMs can only act on 50.
Tying it all back to Business KPIs
Technical metrics are great for data scientists, but founders and executives care about one thing: revenue. This is where you connect the dots between your model's performance and the company's bottom line. It’s time to stop talking about scores and start talking about dollars.
Here are the business-focused metrics that really matter:
- MRR at Risk Identified: How much Monthly Recurring Revenue is tied to the accounts your model flags each month? This metric instantly translates abstract churn scores into a concrete financial figure that everyone can understand.
- Customer Lifetime Value (CLV) Saved: When your team successfully saves an at-risk account, you haven't just saved a single monthly payment. You've preserved their entire future revenue stream. Tracking the CLV of saved customers showcases the long-term ROI of your retention program.
- Lift and Gain Charts: These visuals are fantastic for showing just how much better your model is than shooting in the dark. A lift chart can show that the top 10% of customers your model flags are, say, 5x more likely to churn than the average customer. This proves your model is efficiently concentrating risk, allowing your team to focus their energy where it will have the biggest impact.
When you focus on these metrics, the conversation shifts from “how good is the model?” to “how much value is this model creating?” A successful churn model isn't the one with the highest AUC; it's the one that drives smarter retention decisions and protects your revenue, month after month.
Turning Churn Predictions into Retention Wins
A predictive churn model that just sits on a dashboard gathering dust is a massive missed opportunity. The real magic isn't in the prediction itself—it's in the action you take because of it. The whole point is to turn those abstract churn scores into concrete retention wins that protect your bottom line.
This all starts by translating a customer's churn probability into a clear, actionable tier. This segmentation becomes your team's new playbook, helping them move away from a one-size-fits-all approach and focus their energy where it will have the biggest impact.
From Scores to Segments
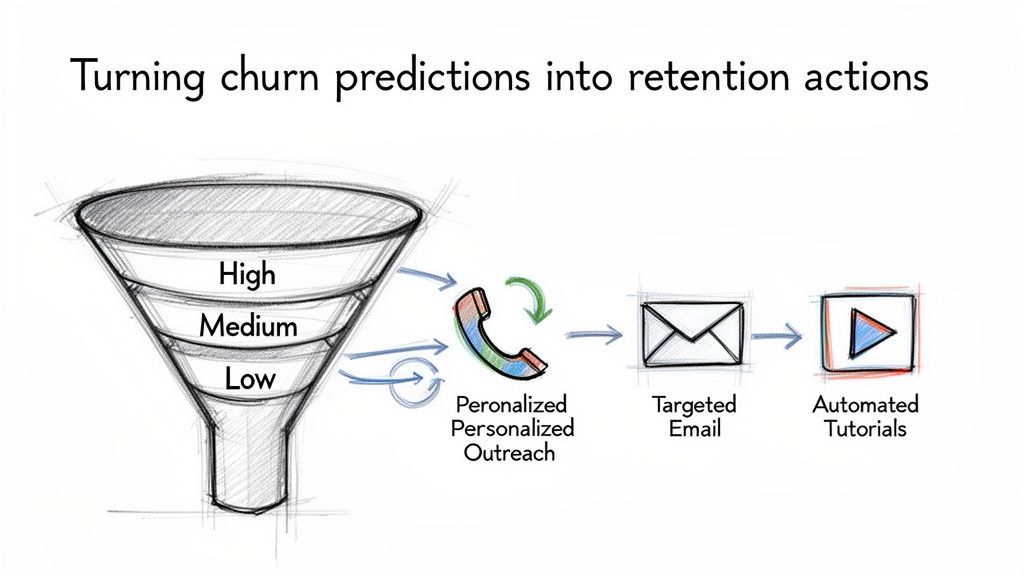
Imagine your customer base as a pyramid of risk. Your model gives you the power to slice that pyramid into distinct layers, where each layer gets a completely different type of intervention.
- High-Risk (Top 5-10%): These are your code-red accounts. A churn probability of 75% or higher is a major red flag, and it demands an immediate, high-touch, personal response from your customer success team.
- Medium-Risk (10-30%): This group is wobbling but hasn't fallen over yet. They're perfect candidates for targeted, automated campaigns designed to pull them back in and remind them of your product's core value.
- Low-Risk (Everyone Else): These are your happy, engaged customers. The goal here is simple: keep delivering value and monitor their health to make sure they stay that way.
This kind of segmentation turns an overwhelming list of customers into a prioritized, manageable workflow. It’s a core concept that also powers a dynamic customer health score.
Crafting Targeted Retention Campaigns
Once you have your segments, you can start running specific plays for each tier. A generic "we miss you" email just isn't going to cut it here. Your response needs to be as specific as the prediction that triggered it.
For High-Risk Accounts:
- Personal CSM Outreach: A customer success manager should be on the phone or sending a personal video message to understand what's causing the friction.
- Executive Check-in: For your highest-value accounts, a quick note from a founder or C-level executive can make a world of difference. It shows you genuinely value their business.
- Proactive Support: Dig into their recent support tickets and usage patterns. Can you offer a specific, helpful solution before they even ask for it?
For Medium-Risk Accounts:
- Targeted Email Nudges: Did the model flag that they stopped using a key feature? Send them an email with a short guide or video that highlights its benefits.
- In-App Educational Content: Trigger a tooltip or a short, interactive walkthrough the next time they log in to remind them of the value they're missing out on.
- Exclusive Webinars: Invite them to a training session focused on advanced features they haven't adopted yet. It’s a low-effort way to re-engage them.
A great predictive churn model doesn't just tell you who is at risk; its underlying data tells you why. Use these insights to make your outreach feel less like a sales pitch and more like a helping hand.
To really make this work, you need to bake churn predictions into your wider customer retention efforts. A well-thought-out SaaS product marketing strategy for growth and retention is critical for driving both acquisition and, just as importantly, keeping the customers you worked so hard to win.
Monitoring Model Drift
Finally, remember that a churn model is not a "set it and forget it" tool. Your product evolves, your customers' needs change, and the market shifts. Over time, all these changes cause model drift—a slow, creeping decay in your model's accuracy as the patterns it learned become outdated.
To fight this, you have to periodically retrain your model with fresh data, usually every few months. This keeps it sharp and ensures it's learning from current customer behavior, not yesterday's. When tuned correctly, a model's performance can be stunning. For example, it’s not uncommon to see models where over 83% of the customers flagged as "most likely to churn" actually do leave—a testament to its precision.
Common Questions About Predictive Churn Models
As SaaS teams start digging into predictive churn modeling, a few practical questions always seem to pop up. It can feel like a huge, intimidating project, but breaking it down can make the whole process feel much more manageable and set the right expectations.
We've pulled together the most common questions we hear from founders and customer success leaders to help you get from raw data to real, actionable insights.
How Much Historical Data Do I Really Need?
Probably less than you think. While it's true that more data is generally better, you can often get a surprisingly accurate model off the ground with just 6-12 months of solid customer history.
What's most important isn't the sheer volume of data, but having enough examples of churn for the model to learn from. For many growing companies, even just a few hundred churned accounts can be enough to train a model that points your team in the right direction. You don't need years of perfect data to get started.
Will a Churn Model Create a Customer Privacy Headache?
Not if it's built the right way. Modern churn prediction should be privacy-first from the ground up.
These models don't need to know who your customers are. They work with anonymized signals—things like a dip in feature usage, a credit card expiring, or a subscription downgrade. The model just needs to know that an account is showing risk; it doesn't need the customer's name, email, or other personally identifiable information (PII).
This is a key distinction. By focusing on behavioral and subscription metadata, you get powerful insights into churn drivers while staying fully compliant with regulations like GDPR and CCPA. It's about protecting your customers and your business.
How Quickly Can I Expect to See Results?
The impact can be felt almost immediately. The moment your model starts spitting out churn risk scores, you can start using them.
Your customer success team can instantly refocus their efforts on the accounts that are most likely to leave. Many teams see real, tangible saves within the first 30-60 days. Just by concentrating on the top 10% of at-risk customers, it's common to prevent a handful of high-value cancellations in the first month alone, making the ROI clear right away.
Ready to stop reacting to churn and start preventing it? LowChurn uses AI to predict which of your Stripe customers are at risk, giving you the foresight to act. Connect your account in 60 seconds and see your first churn predictions today. Find out more at LowChurn.