At its core, the SaaS lifetime value calculation projects the total revenue you can expect from a single customer over their entire relationship with your business. The simplest formula is your Average Revenue Per Account (ARPA) divided by your Customer Churn Rate.
This calculation reveals the true long-term worth of acquiring a new user, and getting a handle on it is absolutely essential for building a sustainable, profitable SaaS company.
Why LTV Is Your Most Important SaaS Metric
Let's move beyond the textbook definition. Think of Lifetime Value (LTV) less as just another number on a dashboard and more as the true health score of your SaaS business. It’s the North Star that guides you toward long-term profitability, not just fleeting, short-term revenue gains.
Picture this all-too-common scenario: your Monthly Recurring Revenue (MRR) is climbing, but so is your churn rate. You're pouring money into acquisition, but customers are slipping out the back door just as fast. This is the classic "leaky bucket" problem, and it’s precisely why a solid SaaS lifetime value calculation is critical for survival.
The Story Behind Your Revenue
LTV tells you the real story that your top-line revenue figures often hide. It answers the tough, fundamental questions that will ultimately determine your company's future:
- Is our growth actually sustainable? A high LTV means each customer contributes far more than they cost to acquire, which is the fuel for a healthy growth engine.
- Are we acquiring the right kind of customers? By segmenting LTV, you can pinpoint which marketing channels or customer profiles bring in the most valuable users—and which ones don't.
- Can we really afford to invest more in growth? A strong LTV gives you the confidence to ramp up marketing spend, knowing the return will justify the investment.
This single metric informs every key decision you make, from your marketing budget and pricing strategy to your product roadmap. It’s also the foundational element of the LTV to CAC ratio, which many consider the ultimate benchmark for sustainable growth. We dive deep into this crucial relationship in our complete guide to the LTV to CAC ratio.
Setting the Benchmark for Success
The LTV:CAC ratio isn't just for internal navel-gazing; it's how the health of a SaaS business is judged by investors, partners, and acquirers.
Industry benchmarks suggest healthy SaaS companies maintain a median LTV/CAC ratio of 3:1. In simple terms, for every $1 you spend acquiring a customer, they should deliver at least $3 in lifetime value. A 2023 report showed top-quartile firms with low churn achieving an impressive 5:1 ratio, which in turn fueled growth that was twice as fast.
A rising MRR can easily mask a fatal churn problem. LTV, on the other hand, exposes the raw truth about your business's long-term viability. It forces you to focus on retention and value, not just acquisition.
To get even more nuanced insights into this vital metric, other great resources like this guide on Mastering Lifetime Value SaaS are worth a read. Ultimately, by embracing the LTV calculation, you shift from chasing vanity metrics to building a resilient, profitable company founded on genuine customer value.
The Essential Formulas for Calculating LTV
Alright, let's get our hands dirty and turn the idea of LTV into actual numbers you can use. You don't need to be a math whiz for this—it’s all about breaking down the health of your subscription business into a few key components.
We'll start with the most common formula in the SaaS playbook. It’s the fastest way to get a gut check on what your customers are worth.
The Simple LTV Formula
At its core, LTV boils down to two things: how much a customer pays you on average, and how long they actually stick around. The easiest way to think about "how long they stick around" is by using its inverse—your churn rate.
The formula couldn't be simpler:
Simple LTV = Average Revenue Per Account (ARPA) / Customer Churn Rate
Let’s say you run a project management tool called "TaskFlow." Your average customer pays you $60 per month, which is your ARPA. Digging into your Stripe data, you see that you lose about 4% of your customers each month. That's your churn rate.
Plugging those numbers in, you get:
LTV = $60 / 0.04 = $1,500
What this tells you is that the average TaskFlow customer will generate $1,500 in top-line revenue over their entire time with you. It’s a fantastic starting point for figuring out your acquisition budgets and just getting a baseline feel for your business model. For a deeper dive, there's a great guide on practical CLV formulas that explores some of the nuances.
Factoring in Profitability with Gross Margin
The simple LTV formula is a great first step, but it has one major blind spot: it assumes every dollar of revenue is pure profit. It completely ignores the real costs of delivering your service—things like hosting fees, third-party software licenses, and the salaries for your customer support team.
That's where the Gross Margin-Adjusted LTV comes in. This version gives you a much more honest picture of your profitability.
Here's the adjusted formula:
Gross Margin-Adjusted LTV = (ARPA * Gross Margin %) / Customer Churn Rate
Back to our TaskFlow example. We know the ARPA is $60 and the churn is 4%. After adding up your costs, you calculate that your gross margin is 75%. This means that for every dollar you bring in, 75 cents is profit before you account for sales, marketing, and R&D.
Now, the math looks a little different:
LTV = ($60 * 0.75) / 0.04 = $45 / 0.04 = $1,125
See the difference? This more realistic figure shows that the profitable lifetime value of a customer is actually $1,125. This is the number you should be using to make smart financial decisions, especially when it comes to how much you can truly afford to spend to acquire a new customer.
Putting LTV Calculation into Practice
Ever wonder why some SaaS companies seem to print money while others just burn through it? It almost always comes back to a deep understanding of LTV and how it stacks up against their acquisition costs.
Imagine a typical B2B SaaS company with a $50 monthly ARPA, a healthy 70% gross margin, and a 4% monthly churn rate. The profit from each customer every month is $35, which gives them a margin-adjusted LTV of $875 ($35 / 0.04). That single number dictates their entire growth strategy.
This LTV Health Score process flow really brings it home, showing how LTV isn't just a vanity metric—it's the core input for making decisions that lead to real, sustainable growth.
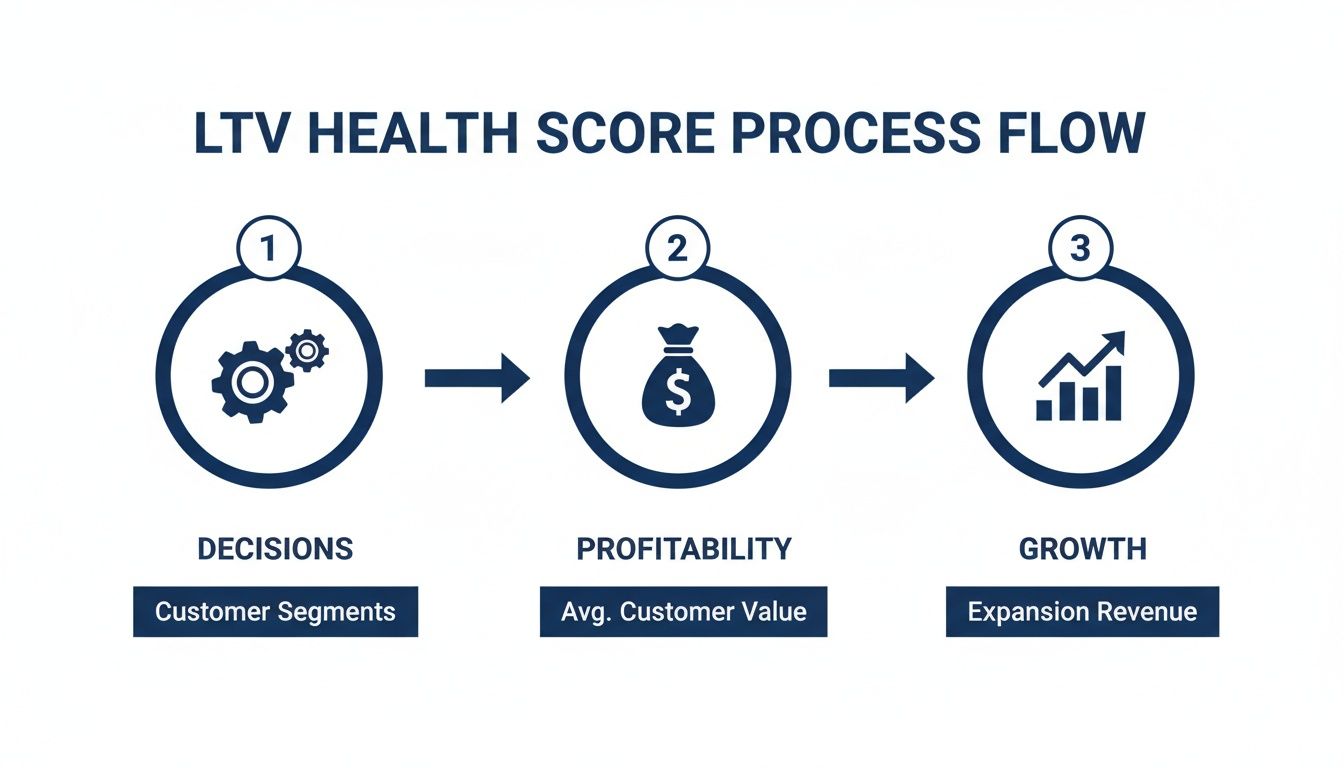
As the visual shows, getting LTV right isn't just an academic exercise. It’s the engine that powers a strategic flywheel, driving smarter decisions across the board. The best part? You can build a simple calculator for this yourself in Google Sheets or Excel.
To help you keep these straight, I've put together a little cheat sheet.
Your LTV Formula Cheat Sheet
Here’s a quick-reference table summarizing the LTV formulas we've covered, what goes into them, and when you should pull each one out of your toolbox.
| LTV Formula | Calculation | Best Used For |
|---|---|---|
| Simple LTV | ARPA / Churn Rate | A quick, high-level estimate of top-line revenue potential. Great for a back-of-the-napkin calculation. |
| Margin-Adjusted LTV | (ARPA * Gross Margin) / Churn Rate | Making accurate, profit-aware decisions about marketing spend and overall business health. |
| Cohort-Based LTV | Varies based on cohort analysis | Pinpointing your most valuable customer segments and understanding which acquisition channels deliver the best ROI over time. |
My advice? Start with the simple formula to get your bearings. As your data gets cleaner and your understanding deepens, graduate to the more refined models. It’s a manageable approach that will grow with your business.
Going Deeper: Why Advanced LTV Models Are a Game-Changer
A single, company-wide LTV number can be dangerously misleading. While the basic and margin-adjusted formulas are a great place to start, they average everything out, treating every customer as if they're exactly the same. But you and I both know that’s not the reality—some customers are worth exponentially more than others. This is where you need to get more sophisticated.
Relying on a blended LTV is like driving with a blurry windshield. Sure, you can see the road ahead, but you're missing the critical details that let you spot opportunities and avoid hazards. Advanced models bring everything into sharp focus, paving the way for smarter, more profitable decisions.

Uncovering Hidden Trends with Cohort Analysis
The most powerful next step in your saas lifetime value calculation is cohort analysis. This isn't just about number-crunching; it's about storytelling. You group customers based on shared characteristics—most often, the month they signed up—and then you track their value over time. Instead of one flat number, you get a dynamic picture of how different groups of customers behave.
Let’s play this out with a real-world scenario. Say you ran a big marketing campaign in Q1 focused on a new integration. Then, in Q3, you rolled out a major new feature. By creating separate cohorts for customers who signed up in each quarter, you might uncover something fascinating:
- The Q1 "Integration" Cohort: These folks are sticking around longer and upgrading more often, showing a 30% higher LTV. The integration clearly resonated with a high-value audience.
- The Q3 "New Feature" Cohort: This group has a lower LTV. The feature drove a lot of signups, but it seems it didn't attract your ideal, long-term customer.
This kind of insight is pure gold. It tells you exactly which marketing messages and product features attract your best customers, so you can double down on what’s working. If you want to dig into the mechanics, we have a complete guide on what is cohort analysis.
Relying on a blended, company-wide LTV is a common mistake. It averages out your best and worst customers, hiding the crucial insights you need to attract more of the former and less of the latter.
This segmented view is especially critical for early-stage SaaS companies. One analysis found that for SaaS businesses around 18 months old, a whopping 20-30% of revenue came from expansions within their top-performing cohorts. When you pair this with churn reduction, the impact is massive. Just a small improvement—like dropping churn from 4% to 3%—can lead to a 33% uplift in LTV. You can explore this classic formula in more detail in Maxio's CLV calculation guide.
Predicting the Future with Predictive LTV
While cohort analysis gives you a rich historical view, predictive LTV helps you see into the future. It’s a game-changer for getting ahead of the curve. Instead of waiting months to see how a new cohort pans out, predictive models use early behavioral signals to forecast a customer's total future worth.
This is definitely more complex, often leaning on machine learning to analyze signals like:
- Product Engagement: How often a user logs in, which features they live in, and how deeply they’ve integrated your tool into their workflow.
- Support Tickets: The number and type of interactions a customer has with your support team.
- Firmographics: The customer's company size, industry, or other business data.
This is where modern analytics and churn prevention platforms really come into their own. They can sift through these signals to flag high-potential customers who might be ready for an upsell. Even more importantly, they can spot churn risks long before a customer even thinks about canceling.
For instance, a platform like LowChurn uses these signals to generate a dynamic health score for each customer. If a high-value account's score suddenly drops, it can trigger an alert for your customer success team. They can then intervene before that projected LTV goes up in smoke. This fundamentally shifts your retention strategy from reactive to proactive, directly protecting your bottom line.
Common LTV Calculation Mistakes to Avoid
Getting the math wrong on your SaaS lifetime value calculation can lead to some seriously disastrous business decisions. An inflated LTV can trick you into burning cash on acquisition, while undercooking the numbers can make you too timid, causing you to miss out on real growth. I've seen founders make these mistakes time and again, so let's walk through the most common pitfalls and how you can steer clear of them.
Confusing Revenue with Profit
This one is probably the single most dangerous mistake a SaaS business can make. When you calculate LTV using total revenue—your Average Revenue Per Account (ARPA)—without subtracting the cost of goods sold (COGS), you’re looking at a fantasy number. It pretends every dollar of revenue is pure profit, and we all know that's just not reality.
Your COGS are the real, hard costs of keeping the lights on for your customers. Think of things like:
- Hosting and infrastructure (your AWS or Heroku bill)
- Salaries for your customer support and success teams
- Fees for any third-party tools baked into your product
If you ignore these costs, you aren't measuring a customer's actual value to your bottom line; you're just tracking their top-line spend. For any serious strategic planning, you absolutely have to use the gross margin-adjusted LTV formula. It’s a simple switch that gives you a much more honest and actionable metric for deciding on your marketing budget and understanding your true financial health.
Relying on a Single Blended LTV
A single, company-wide LTV is a vanity metric. It’s not a strategic tool. It lumps your best enterprise clients in with your worst freemium-to-paid upgraders, completely hiding the critical insights you need to grow your business effectively. That blended number tells you nothing about which customer segments are really moving the needle.
Let's imagine a real-world scenario. Say you have two main acquisition channels:
- Paid Ads: Brings in customers with an LTV of $800.
- Content Marketing: Attracts customers with an LTV of $1,500.
If you just look at a blended LTV of $1,150, you might think both channels are pulling their weight more or less equally. But the truth is, your content marketing is attracting customers who are nearly twice as valuable. Without segmenting, you'd never know to double down on your content strategy and maybe pull back on less efficient ad spending.
A single LTV figure hides the truth. Segmenting your LTV by acquisition channel, pricing plan, or customer persona is the only way to get actionable intelligence that drives real growth.
Calculating LTV with Immature Data
In the early days of a startup, you're running on excitement and adrenaline, but you're short on historical data. It’s tempting to take your first few months of churn numbers and project out a lifetime value, but this can be incredibly misleading. Your first batch of customers is rarely representative of who you'll be serving in the long run.
Early adopters can be more forgiving of bugs or have unique needs that don't scale across a wider market. A low churn rate in the first three months with only 50 customers simply isn't a statistically significant foundation for a reliable LTV.
As a rule of thumb, I always advise founders to wait until they have at least 12-18 months of consistent subscription data from a decent-sized customer base. Only then should you start treating your LTV as a trustworthy guide for major strategic decisions. Before that point, think of it as a directional indicator, but take it with a huge grain of salt. Your focus should be on gathering more data and truly understanding your customer behavior before you bet the farm on a premature calculation.
Putting Your LTV Number to Work: Actionable Strategies
Alright, you've run the numbers and calculated your LTV. Now what? The calculation itself isn't the endgame—it's the starting pistol. The real value comes from turning that number into a growth strategy.
We’re going to focus on three proven levers you can pull to boost your LTV: getting more revenue from each account, keeping customers around longer, and simply signing up better-fit customers in the first place.
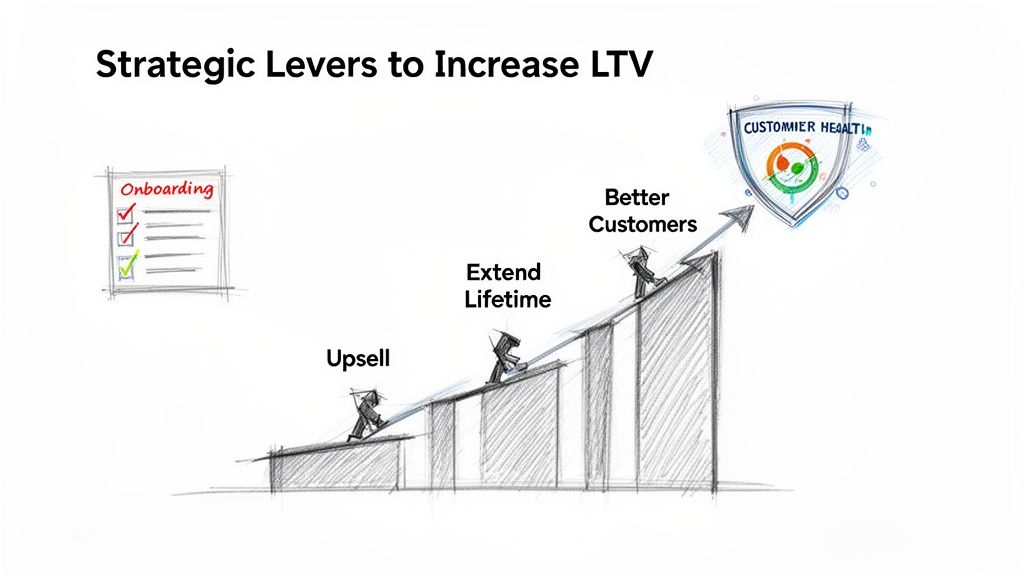
This is where you shift from just analyzing the data to actually making it work for you. The goal is to implement smart, data-informed changes that create a measurable lift in what each customer is worth.
Boost Your Average Revenue Per Account
Increasing your Average Revenue Per Account (ARPA) is the most direct path to a higher LTV. This isn't about blind price hikes; it's about strategically delivering more value that customers are genuinely happy to pay more for.
One of the best ways to do this is by finding data-driven upsell opportunities. Watch how people use your product. Look for triggers that show they're bumping up against the limits of their current plan. For instance, if a user on your "Basic" tier keeps hitting their API call limit, that’s a perfect, low-friction moment to suggest an upgrade to the "Pro" plan.
Here are a few ways you can engineer a higher ARPA:
- Value-Based Pricing Tiers: Design your plans around features that solve bigger and bigger problems. This gives customers a natural ladder to climb as their own business grows.
- Introduce Add-Ons: Offer optional, high-value features that don't require a full plan change, like advanced analytics or priority support. It's an easy "yes" for customers who need it.
- Drive Expansion Revenue: Empower your customer success team to help clients get so much value from your product that they want to use it more—whether that means adding more seats or adopting new features.
A healthy SaaS business often sees 20-30% of its revenue come from expansion MRR. This is your most efficient growth engine because you're selling to people who already know and trust you.
Extend the Customer Lifetime
The other side of the LTV coin is simple: keep your customers happy and paying for longer. Every single month you prevent a customer from churning directly adds to their lifetime value. Proactive retention is your most powerful tool here.
It all starts with a killer onboarding experience. Your number one job is to guide new users to their first "aha!" moment as quickly as possible—ideally within their first seven days. You need to prove your product's value right out of the gate.
Beyond that, you need an early warning system. A dynamic customer health score, like the kind you can get from a platform like LowChurn, can flag an at-risk account based on signals like dropping product engagement. This lets your team step in with a targeted retention campaign before the customer even thinks about canceling. A small reduction in churn from 4% to 3% can boost LTV by over 30%—that's a massive impact.
Acquire Better Customers from the Start
Let's be honest: not all customers are created equal. A huge part of a strong SaaS lifetime value calculation strategy is attracting the right kind of customers—the ones who are most likely to stick around, upgrade, and tell their friends about you.
Start by digging into the LTV of customers from your different acquisition channels. You might discover that users who come from organic search have an LTV that's 50% higher than those from a specific paid ad campaign. That’s a clear signal to double down on your content and SEO efforts.
Look for the patterns among your highest-LTV cohorts.
- What industry are they in?
- What problem were they trying to solve when they signed up?
- Which features are they using day in and day out?
Use these insights to build out detailed ideal customer profiles (ICPs). Then, you can refine your marketing messaging to attract more people just like them. It's far more efficient to acquire a great-fit customer from day one than to try and save a bad-fit one six months down the line.
To go deeper on these tactics, check out our guide on improving customer lifetime value.
Common Questions About SaaS LTV
Even after you've got the formulas down, some practical questions always come up when you start running the numbers on LTV. I hear these all the time from founders, so let's walk through the most common sticking points.
What’s a Good LTV:CAC Ratio for SaaS?
The gold standard everyone talks about is a 3:1 LTV to CAC ratio. Essentially, for every dollar you put into acquiring a customer, you should be getting at least three dollars back over their lifetime with you. It’s a solid benchmark for a healthy, sustainable business.
If you find yourself dipping below that 3:1 mark, it’s often a red flag. It could mean you're overspending on acquisition, your pricing is off, or customers are churning out too quickly. On the flip side, the real top-performers—we're talking public SaaS companies—often boast ratios of 5:1 or higher. That's the kind of efficiency that fuels aggressive, profitable growth.
How Often Should I Be Calculating LTV?
For most SaaS companies, a monthly or quarterly calculation hits the sweet spot. The best cadence really depends on your stage.
- Monthly: If you're an early-stage startup, things change fast. Monthly calculations give you a tight feedback loop, letting you spot trends and react quickly to a sudden spike in churn or a dip in ARPA.
- Quarterly: For more established businesses with stable metrics, a quarterly review is often enough. It smooths out any monthly blips and provides a clearer, big-picture view for strategic planning.
The key is consistency. Pick a schedule and stick to it. That's the only way you can make meaningful comparisons over time and see if your efforts are actually moving the needle.
The biggest mistake I see is treating LTV like a one-and-done calculation. You have to keep your finger on the pulse of this metric. It’s a direct reflection of your business's health and the effectiveness of your growth strategy.
Can I Calculate LTV If I Don't Have Much Historical Data?
You absolutely can, but you have to be honest with yourself that it's an educated guess. When you're just starting out and don't have years of data, you can use your initial churn rate to estimate a customer lifetime (just use the 1 / churn rate formula).
It's also smart to look at industry benchmarks for similar SaaS businesses to sanity-check your assumptions. But remember, this initial LTV is a projection, not gospel. You have to commit to updating your SaaS lifetime value calculation as more real data comes in. Over time, it will become a much more accurate and reliable tool for making decisions.
How Does Expansion MRR Factor Into LTV?
Expansion MRR—all that great revenue from upsells, add-ons, and upgrades—is a huge LTV booster, but the simple formulas often leave it out entirely. If you ignore it, you’re looking at a deflated, incomplete picture of what your customers are truly worth.
To get a more accurate number, you need to weave expansion revenue into the formula. A better approach is to factor your average expansion MRR per account directly into your ARPA calculation. This way, you’re not just looking at what a customer pays at sign-up, but what they grow into over their entire lifecycle. It gives you a much healthier, and more realistic, view of their total value.
Stop losing your best customers to preventable churn. With LowChurn, you can predict which Stripe customers are at risk and get the playbooks to save them—all in under a minute. See how LowChurn can protect your MRR today.