Your customer retention rate, or CRR, is one of the most honest metrics you can track. It cuts through the noise and tells you exactly what percentage of your customers are sticking with you over a specific period.
Simply put, it answers the question: "How many of the customers we had last month are still our customers this month?" It’s a direct reflection of customer loyalty and how much value your product is delivering.
What Does Customer Retention Rate *Really* Tell You?
Imagine your business is a bucket. You're always trying to fill it with water (new customers). That's acquisition. But if that bucket has holes, water is leaking out just as fast as you can pour it in. Retention is all about plugging those leaks.
A high retention rate means you have a solid bucket. It's a clear signal that your product is sticky, your customers are happy, and your business is built on a stable foundation.
This isn't just a feel-good metric; it's fundamental to your profitability. It can cost 5 to 7 times more to land a new customer than to keep an existing one. On top of that, loyal customers tend to spend 67% more with a business over time. Keeping customers isn't just good service—it's smart business.
The Components of the Standard Formula
Before we jump into the math, let's break down the three simple pieces you need to calculate your CRR. Each variable tells a small part of your customer story for the period you're looking at, whether it's a month, a quarter, or a year. For a deeper look at related metrics, this guide on key customer retention metrics is a great resource.
The standard customer retention formula uses these three inputs:
- Customers at the Start (S): The total number of customers you had on day one of the period.
- Customers at the End (E): The total number of customers you had on the last day of the period.
- New Customers Acquired (N): The number of brand-new customers you won over during that time.
Here's a simple way to look at the variables:
Customer Retention Rate Formula At a Glance
| Component | Symbol | Description |
|---|---|---|
| Customers at the Start | S | Your total active customers when the period begins. |
| Customers at the End | E | Your total active customers when the period concludes. |
| New Customers Acquired | N | The number of new customers gained during the period. |
These components don't just feed a formula; they tell a story. For instance, if you acquired a ton of new customers but your total customer count barely budged, you've got a churn problem that needs immediate attention.
This metric is also a critical piece of a much larger puzzle, directly influencing things like Customer Lifetime Value. You can see how they connect in our guide on what is CLTV.
How to Nail Down Your SaaS Retention Numbers
Understanding the concept of customer retention is one thing, but the real magic happens when you can accurately calculate it for your own business. The standard formula is a decent starting point, but for SaaS, we need to look at loyalty through two different—and equally important—lenses: one focusing on customer count and the other on cold, hard revenue.
Let's break down how to calculate both.
The most common metric you'll see is the Customer Retention Rate (CRR). Think of it as a simple headcount. It tells you what percentage of your customers stuck around over a certain period. This is often called "logo retention" because it literally just counts the company logos you've managed to keep on your roster, regardless of their size or spend.
This calculation is the flip side of your customer churn rate. If you want to see the other side of the coin, we have a complete guide on how to calculate churn rate that paints the full picture.
Calculating Retention by Customer Count (Logo Retention)
To get your CRR, you just need three numbers for the period you're measuring, say, the month of June:
- Starting Customers (S): How many customers you had on day one (June 1st).
- Ending Customers (E): The total number of customers on your books on the last day (June 30th).
- New Customers (N): The number of brand-new customers you signed up during June.
The trick here is to isolate the group of customers you started the month with. To do that, you have to subtract all the new faces from your ending total. That's how you know how many of the original crew are still with you.
The Formula: Customer Retention Rate = [ (Ending Customers – New Customers) / Starting Customers ] x 100
Let’s walk through a quick example. Imagine your SaaS business had these stats for June:
- You started the month with 200 customers (S).
- You ended the month with 215 customers (E).
- You brought in 30 shiny new customers (N).
Now, let's plug those numbers in: [ (215 – 30) / 200 ] x 100 = 92.5%.
Boom. Your customer retention rate for June was 92.5%.
This flowchart makes it crystal clear—you take your ending customer count, remove the newcomers, and what's left is your pool of retained customers.
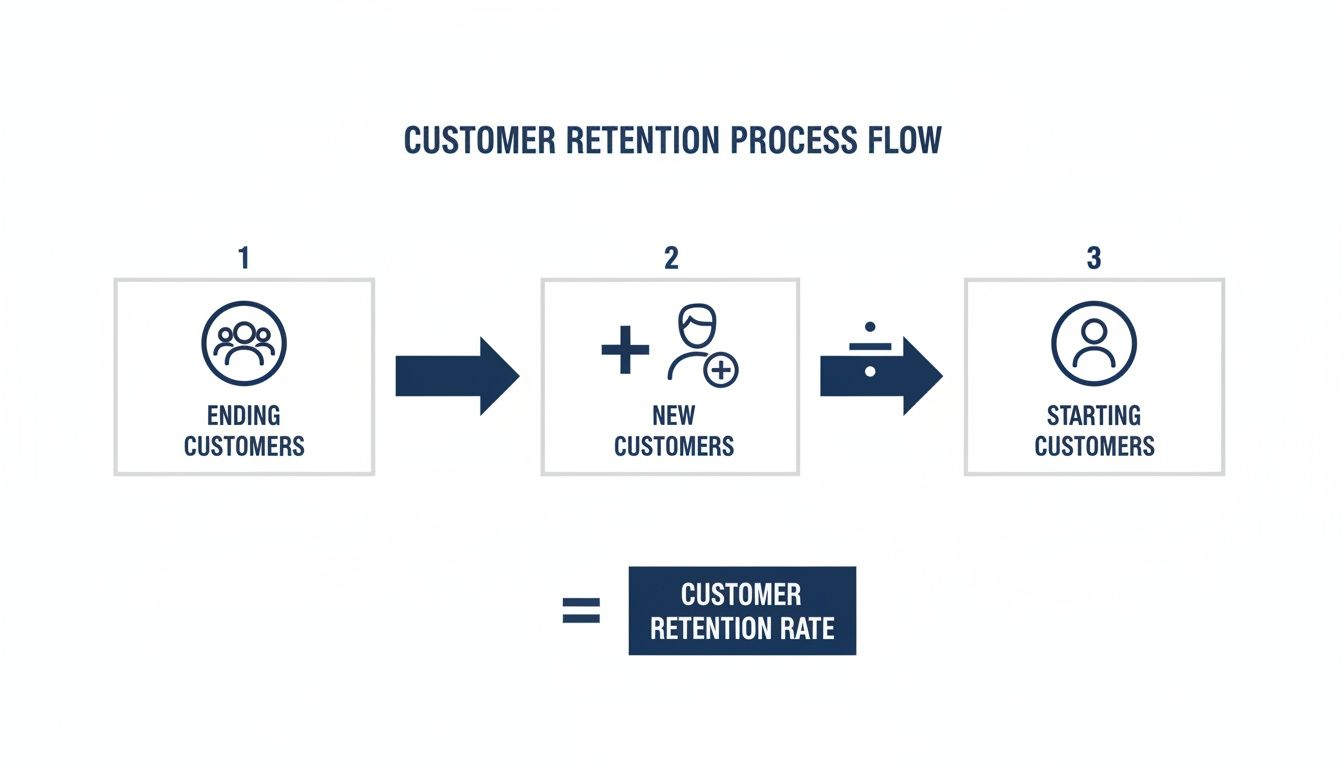
The big takeaway? Always isolate your starting cohort. It’s the only way to get a true retention figure.
Why Revenue Retention Is the Metric That Truly Matters for Growth
Customer retention is a vital health check, but it has a massive blind spot. It treats a customer paying you $50/month exactly the same as an enterprise client paying $5,000/month. Losing one of those is definitely not the same as losing the other.
This is where Net Revenue Retention (NRR) steps into the spotlight.
NRR tells you what percentage of revenue you've held onto from your existing customers. Crucially, it accounts for everything: revenue lost from churned customers, but also revenue gained from existing customers who upgraded, bought more seats, or added new features (this is called expansion revenue).
For a SaaS company, an NRR over 100% is the holy grail. It means your existing customers are spending more with you over time, so much so that it outpaces the revenue you lose from churn. This is "negative churn," and it's a powerful signal that you have a healthy, scalable business that can grow even without signing a single new customer.
CRR tells you if customers are staying. NRR tells you if their value is growing.
What a Good Customer Retention Rate Looks Like
So, you've crunched the numbers and have your customer retention rate. The very next thought is always, "Is this any good?" The honest-to-goodness answer is: it depends. There isn't a single magic number that defines a "good" retention rate. It’s a moving target that changes dramatically based on your industry, business model, and even how long you've been around.
Trying to compare your B2B SaaS company's retention to a direct-to-consumer brand is like comparing apples to oranges. The customer relationships are totally different, as is how often they buy. Naturally, their benchmarks for success are worlds apart.
To give you a clearer picture, let's look at how wildly retention can swing from one sector to another. This table highlights some average rates across different industries.
Customer Retention Rate Benchmarks by Industry
| Industry | Average Customer Retention Rate (%) |
|---|---|
| Media | 84 |
| Professional Services | 84 |
| Automotive & Transportation | 83 |
| IT Services | 81 |
| Construction & Engineering | 80 |
| Financial Services | 78 |
| Hospitality, Travel, Restaurants | 55 |
| Retail | 63 |
As you can see, media and professional services firms do a great job of holding onto their customers, hitting an impressive 84% average. On the flip side, retail struggles at 63%, and the e-commerce world faces an even tougher battle with rates sometimes dipping as low as 30–38%. If you're curious, you can dig deeper into these industry retention rate differences on trypropel.ai.
Saas Retention Benchmarks You Should Know
For a SaaS business, the bar is set much higher. Thanks to the recurring revenue model, a healthy retention rate isn't just a nice-to-have; it's the very engine of sustainable growth. While the exact figures can vary, the SaaS world generally agrees on a few key performance tiers for annual retention.
Think of these as a helpful yardstick to see where you stand:
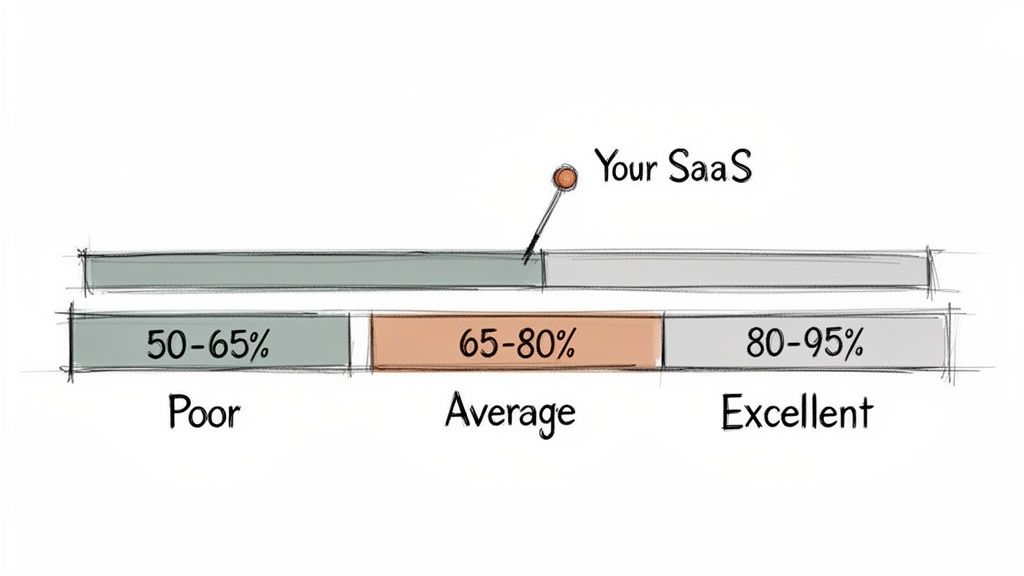
- Below 80% (Needs Improvement): A rate down here is a red flag. It points to a serious churn problem and could mean your product isn't quite hitting the mark with your customers or the user experience is letting you down. It's time for some urgent attention.
- 80% to 90% (Good): This is a solid, healthy place to be for most SaaS companies, especially if you're serving small to mid-sized businesses (SMBs). It shows you’re consistently delivering value people are willing to stick around for.
- 90% and Above (Excellent): Hitting 90%+ retention is the gold standard. This signals fantastic product-market fit, a "sticky" product that's hard to leave, and a top-notch customer success effort. Companies in this bracket, especially those catering to enterprise clients, often push their rates as high as 95-97%.
A good rule of thumb for a growing SaaS business is to aim for a monthly customer retention rate of at least 97-98%. Over a year, this compounds to an annual retention rate of roughly 70-80%, giving you a stable foundation to build on.
Why Context Is Everything
I have to say this again: benchmarks are guidelines, not gospel. An early-stage startup just finding its footing will almost certainly have a lower retention rate than a big, established market leader. Likewise, a product with thousands of low-cost subscriptions will have completely different retention dynamics than a high-touch enterprise platform with massive contracts.
Ultimately, the most important benchmark is your own historical performance. The real goal is continuous improvement—plugging the leaks in your own bucket, month after month. Focusing on creating an upward trend in your own retention is far more valuable than obsessing over an arbitrary industry number. Use these benchmarks to set realistic goals, but always let your own data be your primary guide.
Common Mistakes When Measuring Retention
Calculating customer retention seems simple enough on the surface, but a few common pitfalls can easily skew the numbers. These mistakes can give you a false sense of security or send you scrambling to fix a problem that doesn't actually exist.
Getting this right is a big deal, because these are the numbers that guide major business decisions. Let's walk through the most common traps so you can make sure your data is telling you the real story.
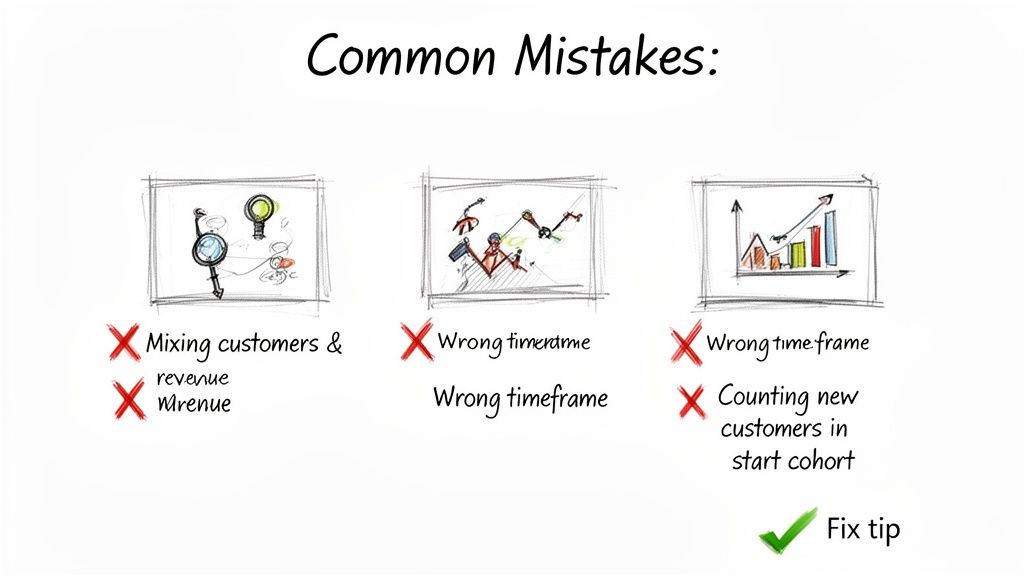
One of the easiest mistakes to make is failing to properly define your starting group of customers. Remember, the formula requires you to subtract new customers acquired during the period from your final count. Teams sometimes skip this step, which artificially inflates the retention rate by counting brand-new signups as "retained." It’s a simple oversight that can completely mask a growing churn problem.
Mixing Up Customers and Revenue
This next one is huge. Many businesses confuse customer retention (sometimes called logo retention) with revenue retention. They are not the same thing, and the difference is critical.
Imagine your customer retention rate is a fantastic 98%. That sounds great, right? But what if that 2% who churned were your biggest enterprise accounts, while the customers you kept were all on a $10/month starter plan? Your customer count looks healthy, but your revenue could be in a nosedive. A $10,000/month account and a $10/month account are not equal.
Always track both customer retention and revenue retention (NRR) side-by-side. One tells you if people are staying; the other tells you if their value is growing.
This dual view gives you a much more complete and honest picture of your business's health and momentum.
Using Inconsistent Time Periods
Consistency is everything when it comes to tracking metrics. A surprisingly common error is comparing retention rates calculated over different timeframes—like pitting last quarter's monthly rate against last year's annual rate. That’s an apples-to-oranges comparison that yields zero meaningful insight.
To see real trends, you have to stick to a consistent schedule. It’s the only way to know if you’re actually improving.
Here’s how to get it right:
- Pick a Cadence: Decide if you’re going to measure monthly, quarterly, or annually. For most SaaS companies that need to move fast, monthly is the way to go.
- Stay Consistent: Every single calculation must use the exact same period length. Comparing May's monthly retention to June's monthly retention? Perfect. That’s a real trend.
- Align with Your Goals: The period you choose should make sense for your business rhythm and planning cycles. This makes the data immediately actionable.
By standardizing your measurement periods, you can track your progress with confidence, see the real impact of your retention efforts, and make decisions based on data you can actually trust. It’s a simple discipline that prevents a world of confusion.
Actionable Strategies to Improve Your Retention Rate
Knowing your customer retention rate is like checking the scoreboard. But to win the game, you actually have to improve that score. It's not enough to just run the numbers. Real, sustainable growth isn't just about chasing new customers; it's forged by keeping the ones you've already earned.
The bedrock of high retention is a customer experience that's both seamless and genuinely valuable. This is the new competitive battlefield. In fact, research shows that 44.5% of companies now see customer experience as their main differentiator.
Think about it: customers who have a great history with you spend 140% more. On the flip side, 59% will ditch you after just a couple of bad run-ins.
Every single interaction matters, starting with a smooth onboarding that gets users to that "aha!" moment as fast as humanly possible.
Build a Proactive Customer Success Framework
If you're waiting for customers to complain, you're already losing. The best approach is a proactive one—anticipating their needs, spotting friction points, and offering a hand before problems get out of control. This is where a dedicated customer success strategy pays for itself.
A proactive framework isn't just a vague idea; it's built on a few key pillars:
- Structured Onboarding: Don't just dump a list of features on new users. Guide them toward achieving their specific goals so they see immediate value from your product.
- Regular Check-ins: Schedule quick health checks to chat about their progress, get honest feedback, and make sure they’re using your product to its full potential.
- Educational Resources: Create a solid library of tutorials, webinars, and how-to guides. Empowering users to solve their own problems helps them master your tool and stick around.
Fostering strong brand loyalty is a core part of this, and you can learn more about Building Brand Loyalty Through Exceptional Customer Support.
Harness Predictive Analytics to Prevent Churn
The most effective retention strategies are fueled by data. Instead of guessing which customers are unhappy, modern tools can use predictive analytics to flag at-risk accounts with surprising accuracy. This is where AI-powered platforms completely change the game.
By sifting through thousands of data points—things like product usage patterns, how often they contact support, and their subscription history—AI can spot the subtle signs of disengagement long before a customer even thinks about canceling.
This kind of intelligence lets your team step in at just the right time. Forget sending a generic "we miss you" email after they've churned. Now you can reach out with a helpful, targeted solution while they’re still an active user.
For example, an AI tool can surface at-risk customers right on a dashboard, empowering your team to take decisive action.
The screenshot above shows how a platform like LowChurn gives you a clear, prioritized list of at-risk accounts, complete with actionable health scores. This transforms your customer success team from reactive firefighters into proactive retention experts.
Armed with these insights, you can run specific plays—like offering a personalized training session to someone struggling with a feature or sending a special offer to a price-sensitive account. These small interventions can turn a potential churn event into an opportunity to build even stronger loyalty. For a deeper dive, check out our guide on how to improve customer retention.
Got Questions? We’ve Got Answers.
We've walked through the formulas, the benchmarks, and the common mistakes. Now, let's clear up some of the questions that pop up most often when people start digging into customer retention. Think of this as your quick-reference guide to mastering the metric.
How Often Should I Calculate Retention?
For most SaaS companies, monthly is the magic number. Calculating your retention rate every month keeps it in sync with your Monthly Recurring Revenue (MRR) and gives you a real-time feel for the health of your business. It's the perfect rhythm for your teams to see the direct impact of their work.
Of course, quarterly and annual numbers are crucial for board meetings and big-picture strategy. But the monthly snapshot is what gives your customer success and product teams the agility they need to spot trends and act on them before they become problems.
What's the Difference Between Retention and Churn?
Think of retention and churn as two sides of the same coin. They tell you the same story, just from opposite perspectives.
- Retention Rate: This is the percentage of customers who stick with you over a set period.
- Churn Rate: This is the percentage of customers you lose in that same timeframe.
So, if you have a 97% monthly customer retention rate, your churn rate is 3%. It's that simple. But while they're mathematically linked, framing it as "retention" often sparks a more positive, proactive mindset. It's about delivering value and keeping customers happy, whereas focusing only on churn can put you in a constant state of damage control.
Can I Have High Retention but Still Lose Revenue?
You bet. And this is a dangerous blind spot if you're only looking at customer retention. You might be celebrating keeping 98% of your customers, but if the 2% who walked away were your biggest enterprise accounts, your revenue just took a massive hit.
This exact scenario is why you absolutely have to track Net Revenue Retention (NRR).
NRR gives you the full picture. It doesn't just subtract the revenue you lost from churn and downgrades; it also adds the new revenue you gained from expansions and upgrades from your existing customers. Hitting an NRR over 100% is the holy grail for a SaaS business—it means you're growing even without signing a single new customer.
How Can AI Actually Help Improve Retention?
This is where things get really interesting. AI takes retention from a reactive, best-guess effort to a proactive, data-backed strategy. Instead of just reacting after a customer cancels, AI tools can predict who is likely to cancel long before they hit the button.
These platforms analyze thousands of signals in real time—things like how often a user logs in, which features they use (or don't use), how many support tickets they've filed, and their payment history. By spotting patterns, the AI can flag accounts that are showing signs of trouble.
This gives your customer success team a "hot list" of at-risk customers and, more importantly, tells them why they're at risk. Armed with that knowledge, your team can step in with targeted help. Maybe it's a personalized training session for a user who's ignoring a key feature or a quick call to solve a lingering support issue. It turns a potential churn event into a chance to reinforce your value and build a stronger relationship.
Ready to stop guessing which customers are about to churn? LowChurn uses AI to identify at-risk customers with over 85% accuracy, so you can prevent churn before it happens. Connect your Stripe account in less than a minute and find out which customers need your attention today.