Let's get straight to the point: Annual Recurring Revenue (ARR) is your big-picture metric. It tells you the total predictable revenue you can expect from all your subscriptions over the next year, giving you a snapshot of your company's overall health.
On the flip side, Annual Contract Value (ACV) zooms in on the average annualized revenue you get from a single customer contract. This metric is all about understanding your average deal size.
ACV vs ARR: A Strategic Snapshot for SaaS Leaders
For anyone leading a SaaS company, the distinction between ACV and ARR isn't just about financial jargon. These two numbers tell very different, yet equally critical, stories about your business performance. ARR offers a macro view of your company’s stability and growth trajectory. It’s the number investors lean on to see if your predictable revenue engine is running smoothly.
ACV, however, provides a micro-level perspective. It hones in on individual deals, revealing how effective your sales team is, whether your pricing strategy is hitting the mark, and which customer segments are most valuable.
Think of it like this: ARR is the total horsepower of your engine, while ACV is the performance of each individual cylinder. You need to understand both to diagnose problems and optimize for the road ahead.
Ultimately, one metric isn't "better" than the other; they're a powerful duo. A rising ACV often signals future ARR growth, maybe because you’re successfully moving upmarket or your product's perceived value is increasing.
To really nail down the differences, here's a quick breakdown of their core functions.
Core Differences ACV vs ARR
This table cuts through the noise and lays out the fundamental distinctions between these two key metrics.
| Metric Focus | Annual Recurring Revenue (ARR) | Annual Contract Value (ACV) |
|---|---|---|
| Perspective | Company-level (Macro) | Contract-level (Micro) |
| Answers | "How much predictable revenue will we generate this year?" | "What is the average yearly value of one customer contract?" |
| Primary Use | Assessing overall business health and growth forecasting. | Evaluating sales efficiency and individual deal value. |
| Composition | Strictly recurring revenue from all active subscriptions. | Can include recurring revenue and sometimes one-time fees, normalized annually. |
Simply put, ARR shows you the scale of your recurring revenue, while ACV helps you understand the composition and quality of the contracts that build it.
Understanding Annual Recurring Revenue (ARR)
When you want to gauge the financial health of a subscription company, Annual Recurring Revenue (ARR) is the undisputed north-star metric. It represents the predictable revenue you can expect from all your active customer subscriptions, normalized into a one-year figure. Think of it as the pulse of your company—a direct measure of the strength and scale of your recurring revenue engine.
What's crucial here is that ARR only counts revenue that is predictable and repeatable. It intentionally filters out any one-time or variable income. This means things like setup fees, consulting gigs, or one-off purchases are left out. The goal is to get a pure, unadulterated look at the stable, ongoing value your customers bring in.
This sharp focus on predictability is precisely why investors and leadership teams prize ARR so highly. It gives them a reliable baseline for financial forecasting, helps determine the company's valuation, and makes it easier to assess long-term growth potential. A healthy, growing ARR is a clear sign that you've found product-market fit and are good at keeping your customers.
Calculating Annual Recurring Revenue
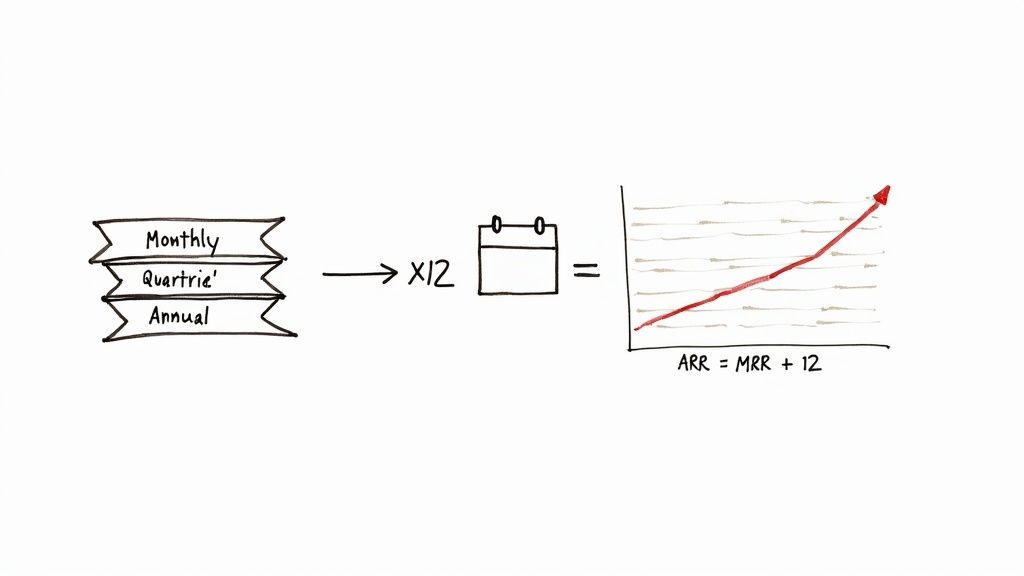
The most common way to calculate ARR is refreshingly simple, making it a powerful tool for any SaaS team. Usually, you'll start with its monthly counterpart, Monthly Recurring Revenue (MRR).
The formula is pretty straightforward:
ARR = Monthly Recurring Revenue (MRR) x 12
For instance, if your SaaS company is pulling in $50,000 in MRR, your ARR would be $600,000. This calculation simply annualizes your current monthly revenue stream to give you a clear snapshot of the year ahead.
Let's walk through a more detailed example. Imagine your company has a few different subscription plans:
- 50 customers on a Basic plan at $100/month (Total MRR = $5,000)
- 20 customers on a Pro plan at $300/month (Total MRR = $6,000)
- 5 customers on an Enterprise plan at $2,000/month (Total MRR = $10,000)
Your total MRR here is $21,000. To get the ARR, you just do the math:
$21,000 MRR x 12 = $252,000 ARR
This calculation provides a snapshot of the company's financial health based on its current subscription commitments. It’s a foundational metric for understanding how much revenue the business can reliably expect over the coming year, barring any new sales, upgrades, downgrades, or churn.
While the formula is simple, it's the bedrock for more sophisticated SaaS financial analysis. As we get into the ACV vs. ARR comparison, just remember that ARR measures the entire forest—your total recurring revenue—while ACV will help us look at the individual trees.
Decoding Annual Contract Value (ACV)
While ARR gives you that 30,000-foot view of your entire revenue engine, Annual Contract Value (ACV) brings you down to the ground level. It zooms in on the average annualized revenue you're generating from a single customer contract. Think of it as the metric your sales and finance teams live and breathe to understand the typical value of each deal they close.
This intense focus on individual contracts is what makes ACV so vital for measuring sales effectiveness. It directly answers the question, "On average, how much is a customer worth to us each year?" Getting that answer right is fundamental for setting realistic sales quotas, segmenting your customer base, and figuring out if your market strategy is actually landing the high-value clients you want.
It's important to note a key difference from ARR: while ARR only tracks recurring revenue, ACV calculations can sometimes include one-time fees. Best practice is to exclude them to get a cleaner, recurring-only value, but the most important thing is to be consistent in how you calculate it across the board.
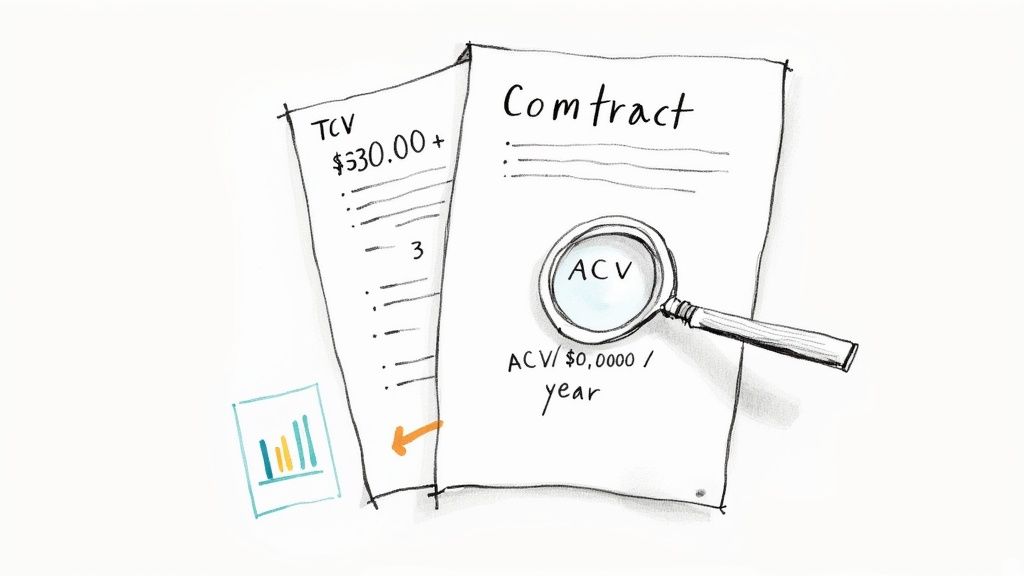
Understanding ACV and Total Contract Value (TCV)
You can't really get a handle on ACV without understanding its relationship with Total Contract Value (TCV). TCV is the full monetary worth of a contract over its entire lifespan, including every recurring payment and any one-time charges like setup or implementation fees.
ACV’s job is simply to normalize that total value into an annual figure. This is especially useful for companies that sign multi-year deals. A three-year contract worth $90,000 in TCV sounds great, but the ACV gives you a much more practical number to work with for your annual planning and forecasts.
By annualizing the contract, ACV allows you to compare a two-year deal with a five-year deal on an apples-to-apples basis. It strips away the contract length to reveal the underlying annual worth of the customer relationship.
Calculating Annual Contract Value
The formula for ACV is pretty simple because its whole purpose is to boil down TCV into a yearly number. This helps you standardize the value of every single deal, no matter how long the contract is.
The basic formula is: ACV = Total Contract Value / Contract Term in Years
Let's walk through a real-world example. Say a new customer signs a three-year contract.
- Subscription Fee: $20,000 per year (totaling $60,000)
- One-time Implementation Fee: $5,000 (paid upfront in year one)
- Total Contract Value (TCV): $60,000 + $5,000 = $65,000
- Contract Term: 3 years
Now, let's plug those numbers into the formula: ACV = $65,000 / 3 = $21,667
So, the ACV for this customer is $21,667. This figure gives you a clean, average annual value for this customer by smoothing out that initial implementation fee over the entire term. This normalized value is what allows you to meaningfully compare different customer segments or evaluate sales performance across deals that have very different lengths and structures. It helps you see past the big TCV number to an insight you can actually act on.
ACV vs. ARR: What They Reveal About Your Strategy
Beyond the math, the real meat of the ACV vs. ARR conversation is understanding the two different stories they tell about your business. These metrics aren't just interchangeable acronyms. One gives you the 30,000-foot view of your entire company, while the other puts individual customer deals under a microscope.
Annual Recurring Revenue (ARR) is your big-picture metric. Think of it as the health monitor for your entire subscription base, showing stability and predictable growth. When your board asks if the company is on a solid trajectory, they're looking at ARR. It's the ultimate scoreboard for your business momentum and long-term viability. A healthy, growing ARR is proof that your model is working and scalable.
On the flip side, Annual Contract Value (ACV) is all about the details. It digs into the efficiency of your sales motion and the value of each customer you sign. A rising ACV is a fantastic sign. It could mean your sales team is getting sharper, you’re successfully landing bigger fish, or customers simply see more value in what you’re offering. ACV is about the quality of your revenue, not just the quantity.
Financial Modeling and Investor Reporting
When you're building out financial plans, ARR and ACV are your dynamic duo. ARR forms the bedrock for long-term revenue forecasts and is central to how your company is valued. It’s the number that defines your growth rate and how you stack up in the market.
ACV, however, provides the granular inputs that make those models realistic. It's essential for calculating your Customer Acquisition Cost (CAC) payback period and truly understanding your unit economics. For instance, a higher ACV can easily justify a longer, more resource-intensive sales cycle—critical information when you’re setting budgets for your sales and marketing teams. Getting a handle on what is CLTV (Customer Lifetime Value) alongside ACV sharpens these models even further, linking the size of the initial deal to its long-term profitability.
Key Insight: ARR shows investors if you're growing. ACV shows them how you're growing—by closing bigger, more valuable deals. A company with flat ARR but rising ACV might be in the middle of a successful shift to enterprise sales, which is often a powerful leading indicator of explosive growth to come.
To give you a clearer picture, let's break down how these two metrics function across different strategic areas.
Strategic Comparison: ACV vs. ARR
| Strategic Dimension | Annual Recurring Revenue (ARR) | Annual Contract Value (ACV) |
|---|---|---|
| Primary Focus | Overall business health and momentum. | Individual deal and customer segment value. |
| Audience | Board members, investors, executive leadership. | Sales leaders, finance teams, product marketers. |
| Key Question | Is our subscription base growing predictably? | Are we signing higher-value customers over time? |
| Strategic Use Case | Long-term forecasting, company valuation, market positioning. | Sales team performance, pricing strategy, CAC payback analysis. |
| Leading/Lagging | Lagging indicator of overall business performance. | Leading indicator of future revenue quality and growth. |
| Time Horizon | Reflects the cumulative, long-term state of the business. | Provides a real-time snapshot of current sales effectiveness. |
This table highlights that you're not choosing one over the other. You're using them together to get a complete, multi-dimensional view of your SaaS business.
A Tale of Two Strategies
Let’s walk through a common scenario. Imagine a SaaS company deciding to pivot from serving small businesses to targeting large enterprise clients.
At the start, their ARR is probably growing at a steady clip from a high volume of small deals, but their ACV is low and flat. As they start the pivot, they might close fewer deals overall, which could even cause new ARR growth to slow down temporarily. But if those few deals are massive enterprise contracts, their ACV will shoot upward.
That rising ACV is the first real proof that the upmarket strategy is gaining traction. It’s the signal that the sales team is learning how to close these bigger, more complex deals. Over time, as more of these large contracts come in, their cumulative impact will kick in, causing the overall ARR to not only bounce back but accelerate far faster than it did before.
This is why tracking both is so critical. ACV can validate your strategic moves months before the impact is obvious in your top-line ARR. They work in tandem, giving you a complete picture of your company’s health and where it’s headed.
When to Use Each Metric for Better Decision-Making
Knowing the definitions of ACV and ARR is one thing, but actually using them to make smarter business decisions is a completely different game. These metrics aren't just for dusty board reports; they're active tools that should be shaping your strategy every day. The trick is knowing which one gives you the clearest answer to the question you're asking.
Think of it like choosing the right tool for the job. You wouldn't use a sledgehammer to hang a picture frame, right? Similarly, ARR gives you the big-picture, long-term view, while ACV provides the detailed, close-up analysis.
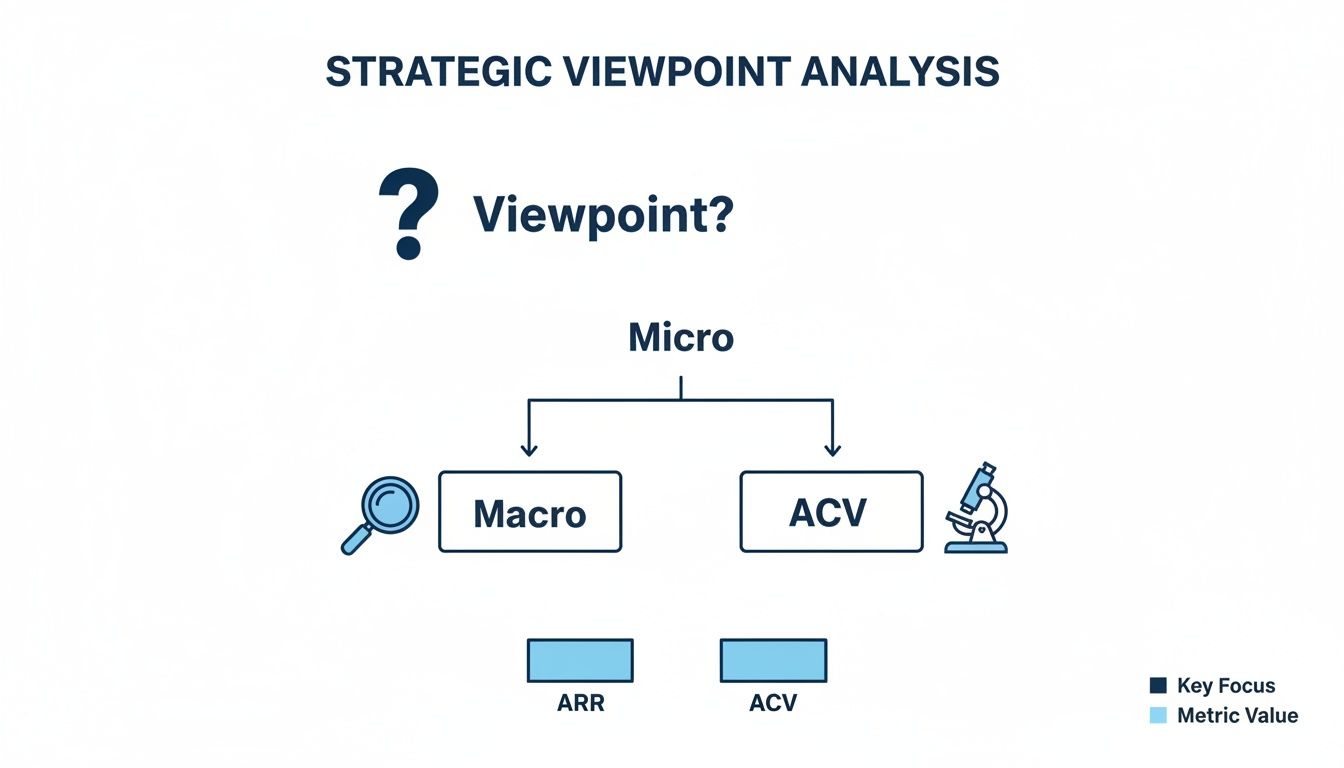
This flowchart nails it: for a broad, company-wide health check, ARR is your metric. For granular, contract-level insights, you need to be looking at ACV.
When to Prioritize ARR
Annual Recurring Revenue is your go-to metric for high-level, strategic planning. It paints a stable, predictable picture of your company's financial health, making it essential for a few key scenarios.
You'll want to lean on ARR for:
- Long-Term Financial Forecasting: Since ARR smooths out the ups and downs of individual deals, it gives you a reliable baseline to project future revenue and build those critical multi-year financial models.
- Company Valuation: When investors or potential acquirers come knocking, ARR is almost always the first number they ask for. It's the cleanest indicator of scalable, predictable revenue—the holy grail of SaaS valuations.
- Cohort Analysis: Tracking ARR by customer cohort helps you see how revenue retention holds up over time. This is absolutely vital for understanding long-term customer value and the real impact of churn.
Bottom line: when you're talking to your board, investors, or your executive team about the big picture, ARR leads the conversation. It answers the fundamental question: "How healthy and predictable is our business as a whole?"
When ACV Takes the Lead
While ARR looks at the entire forest, Annual Contract Value zooms in on the individual trees. This micro-level view is crucial for operational and tactical decisions, especially for your sales and marketing teams on the front lines.
Use ACV when you need to:
- Evaluate Sales Channel Performance: Are leads from your blog closing at a higher ACV than leads from Google Ads? ACV helps you measure the quality of your leads, not just the quantity, so you can put your budget where it really counts.
- Optimize Pricing and Packaging: If you just launched a new enterprise tier, tracking the change in your average ACV is the most direct way to see if it's a hit. A rising ACV confirms that you're successfully attracting higher-value customers.
- Identify Ideal Customer Segments: By analyzing ACV across different industries, company sizes, or regions, you can pinpoint your most profitable customer profiles. This is gold for your go-to-market teams, allowing them to focus their energy for maximum impact.
A consistently low ACV can also be an early warning sign for churn. Smaller contracts often belong to customers with fewer resources and less internal buy-in, making them more likely to cancel when budgets get tight.
Understanding these specific use cases is a cornerstone of effective customer lifecycle management. It ensures you’re applying the right lens at each stage of the customer journey. For example, a steadily rising ACV might be the signal you need to build out a dedicated enterprise sales team—a strategic move that could completely change your company's growth trajectory.
Common Reporting Mistakes That Skew Your Financials
Bad data leads to bad decisions. It’s that simple. When you're looking at ACV vs. ARR, even small reporting errors can completely warp your perception of the company's financial health, sending you down the wrong strategic path. The first step to clean, reliable reporting is knowing where people usually mess up.
One of the biggest and most frequent blunders is letting one-time fees creep into your ARR calculation. ARR is sacred ground; it should only include predictable, recurring revenue. When you start adding in setup fees, implementation costs, or one-off consulting gigs, you're just fooling yourself. It inflates the number and paints a dangerously optimistic picture of your sustainable income.
This mistake torpedoes your ability to forecast accurately and can seriously mislead investors about the actual stability of your business.
Misrepresenting Multi-Year Contracts
Multi-year deals are another common source of confusion. It’s tempting to take the total contract value (TCV) of a three-year deal and book it all under a single year's ARR, but that's just wrong. ARR must always reflect the normalized value for one year of service.
Likewise, ACV calculations can get distorted by things like first-year discounts. If a customer gets a sweet deal for the first 12 months, simply averaging the entire contract value might not tell the real story of the account's ongoing worth. You have to be careful about how you normalize these contracts to get a true picture.
Crucial Takeaway: Consistency is everything. Decide on a methodology for what’s in and what’s out of your ACV calculation and stick to it religiously. Without uniform rules, your data becomes impossible to compare over time.
Failing to get this right doesn't just mess up your revenue metrics; it can hide serious problems elsewhere. An artificially high ARR, for instance, can mask an ugly churn problem bubbling just beneath the surface. To see clearly, you need a rock-solid understanding of all your numbers, starting with an accurate churn rate calculation.
To sidestep these pitfalls, get your finance and RevOps teams on the same page with a clear set of rules:
- Exclude all one-time fees from ARR. No exceptions. Keep ARR pure.
- Normalize multi-year contracts. For ACV, divide the total recurring value by the number of years in the contract term.
- Document your methodology. Write down exactly how you calculate ACV and ARR, and make sure everyone follows the same playbook.
Answering Your Top Questions About ACV vs. ARR
When you get down to the brass tacks of SaaS metrics, a few questions about ACV and ARR pop up time and time again. Let's clear up some of the most common points of confusion so you can put these metrics to work.
Can a Company’s ACV Be Higher Than Its ARR?
Absolutely, and it happens all the time. This is especially common for companies that charge significant one-time fees for things like implementation, training, or data migration.
Think about it this way: Annual Contract Value (ACV) is the total value of a customer's contract, averaged out over a year. That often includes those one-off fees. On the other hand, Annual Recurring Revenue (ARR) only counts the predictable, recurring subscription revenue. So, if you have a strong professional services component, your ACV can easily be higher than your ARR.
Should We Focus on Growing ACV or ARR?
The short answer is both, but you should think about them differently. Growing ARR is the main event—it's what drives your company’s valuation and proves you have a stable, scalable business model. It’s the ultimate scoreboard for long-term health.
Growing ACV, however, is more of a strategic play. When your ACV is on the rise, it’s a strong sign that your sales team is landing bigger deals or moving upmarket. It’s a great way to improve capital efficiency and acts as a leading indicator for future ARR growth.
How Do Discounts and Upgrades Affect These Metrics?
Discounts have a straightforward impact: they pull both metrics down. Offering a discount lowers the recurring revenue you collect, which directly reduces both the ARR and the ACV for that specific contract.
Upgrades are where the magic happens. When a customer upgrades their plan, that new revenue immediately increases your total ARR. Then, when that contract comes up for renewal, its ACV will also increase, reflecting a stronger customer relationship and boosting your all-important net revenue retention.
Stop losing valuable customers to preventable churn. LowChurn uses AI to predict which Stripe customers are at risk of canceling and gives you the tools to save them. Get started for free and protect your ARR today.