
So, what exactly is customer churn analysis? It’s the process of figuring out why customers are leaving your product or service. Think of it as being a detective for your business, uncovering the clues that lead to customer attrition so you can actually do something about it.
It's about finding the leaks in your revenue bucket before it's completely empty.
Understanding the High Stakes of Customer Churn

Imagine your business is a bucket you're working hard to fill. Each new customer is a cup of water, raising the level. But customer churn is a hole in that bucket, constantly draining the revenue and effort you've poured in. It’s not just a minor drip; it's a critical flaw that can make real, sustainable growth feel impossible.
This is why customer churn analysis is so much more than a technical exercise for your data team. It’s a core business function. It pushes you past just knowing your churn rate and forces you to understand the why behind the number. It’s how you find the exact size and location of every leak.
The Compounding Effect of Churn
A small monthly churn rate might not seem like a big deal, but its impact snowballs over time, acting like a massive headwind slowing you down. When a customer leaves, you don't just lose their payment for that month. You lose all of their future revenue, any chance of them upgrading, and the invaluable word-of-mouth marketing they might have provided.
Churn is the silent killer of SaaS companies. It erodes your monthly recurring revenue (MRR) base, forcing your acquisition team to run faster just to stay in the same place.
This compounding damage is easy to underestimate. For example, a seemingly small 5% monthly churn balloons into losing a staggering 46% of your customers over a year. If that rate climbs to 10% a month, you’re looking at a 70% annual loss. At that point, it becomes mathematically impossible to outrun churn with new sales alone. You can dig into more of this data in a full retention report from Churnkey.
From Reactive Problem to Proactive Strategy
Ultimately, the goal of a solid customer churn analysis is to stop firefighting and start fireproofing. Instead of reacting to a flood of cancellation emails, you build an early warning system. By identifying which customers are at risk and the reasons why, you can step in with targeted, helpful interventions before they decide to leave.
This simple shift from reactive to proactive lets you:
- Focus your resources on high-value customers who are showing signs of trouble.
- Guide your product roadmap by fixing the features or friction points that are actively pushing people away.
- Improve your entire customer experience by pinpointing and fixing the exact moments where the journey breaks down.
When you find and patch the leaks, you're not just saving customers—you're building a more resilient, profitable, and faster-growing company.
Decoding the Essential Churn Metrics
Before you can fix a leaky bucket, you have to know how fast the water is getting out. The same goes for customer churn. To get a real handle on why customers are leaving, you first need to speak the language of churn metrics. These numbers aren't just for spreadsheets; they're the vital signs of your subscription business, telling a story about the health of your customer relationships.
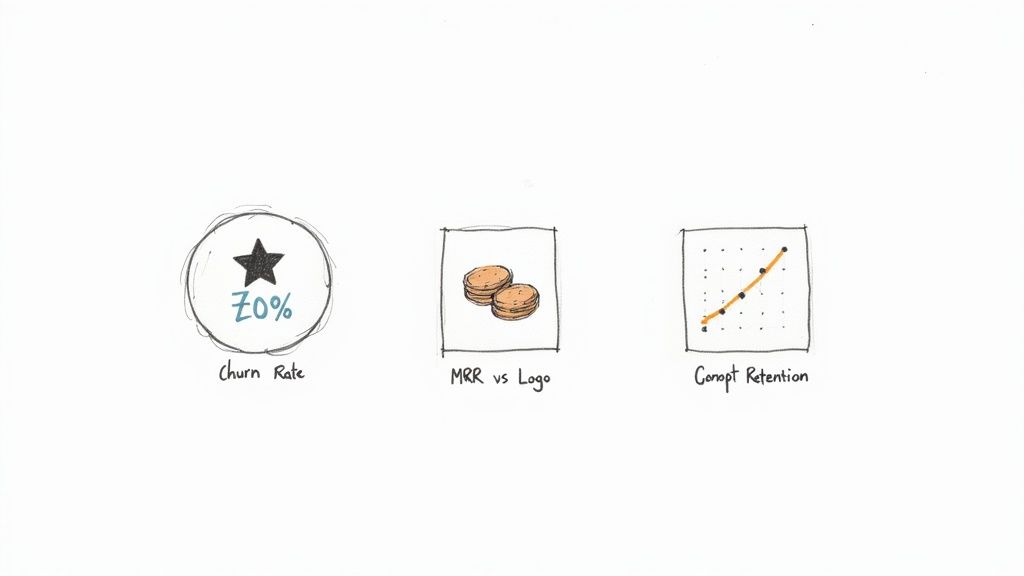
The most common starting point is the Customer Churn Rate. Put simply, this is the percentage of your customers who cancelled their subscriptions over a specific period. It’s your first and most direct signal that something might be wrong.
Let's say you began the month with 500 customers and 25 decided to leave. Your customer churn rate is 5%. While it’s a simple calculation, it's the gateway to deeper questions. For a more detailed breakdown, you can learn the right way to approach churn rate calculation for your SaaS business.
Differentiating Logo Churn and MRR Churn
But just knowing how many customers left isn't enough. Not all customers are created equal in terms of revenue. Imagine losing ten small startups paying $10/month each and one enterprise client paying $1,000/month. In both cases, you lost customers, but the financial hit is worlds apart.
This is where you need to separate two critical concepts:
- Logo Churn: This tracks the raw count or percentage of customers (or "logos") you've lost. In our example, losing 11 customers is your logo churn.
- MRR Churn: This measures the total monthly recurring revenue lost from those cancellations. Here, you lost $1,100 in MRR ($100 from the small accounts + $1,000 from the big one).
Keeping an eye on both is non-negotiable. High logo churn with low MRR churn could mean your entry-level plan isn't delivering. On the flip side, low logo churn with high MRR churn is a major red flag—it means your most valuable accounts are walking out the door.
Uncovering the Full Picture with Net Revenue Churn
Okay, let's add one more layer to this. What if, in that same month, five of your happy customers upgraded their plans, adding $500 in new MRR? This is what we call expansion MRR, and it's a game-changer for understanding your true revenue health.
When you factor this in, you get the most powerful metric of all: Net Revenue Churn.
Net Revenue Churn measures the total revenue change from your existing customer base. It's calculated by taking your churned MRR and subtracting your expansion MRR.
Using our running example, you lost $1,100 in MRR but gained $500 in expansion. Your Net Revenue Churn is $600. This number is so important because it reveals how effectively you're growing revenue within your current customer base. Strong expansion can sometimes hide a growing cancellation problem, so this metric keeps you honest.
Revealing Trends with Cohort Retention
Finally, to see how your business is truly evolving, you need to analyze Cohort Retention. Think of a cohort like a graduating class—a group of customers who all signed up around the same time, like the "January 2024" group. By tracking each "class" on its own journey, you can spot powerful trends.
For instance, you might notice that customers who joined in March (right after you launched a new onboarding flow) are sticking around way longer than the January cohort. That’s a clear signal your new onboarding is a success. This approach helps you move beyond a single, blended churn number to see when and why specific groups of customers leave, giving you a roadmap for what to fix next.
Core Customer Churn Metrics at a Glance
To tie it all together, here’s a quick summary of the key metrics and the critical business questions each one helps you answer.
| Metric Name | What It Measures | Simplified Formula | Key Business Question |
|---|---|---|---|
| Customer Churn Rate | The percentage of customers lost. | (Customers Lost / Total Customers at Start) x 100 | Are we losing too many customers? |
| Logo Churn | The raw number of customers lost. | Count of Canceled Accounts | How many individual accounts did we lose? |
| MRR Churn | The total monthly revenue lost. | Sum of MRR from Canceled Accounts | What's the direct financial impact of cancellations? |
| Net Revenue Churn | The net revenue change from existing customers. | MRR Churn - Expansion MRR | Is our existing customer base growing or shrinking in value? |
| Cohort Retention | How long different groups of customers stay. | % of a Signup Cohort Still Active Over Time | Are our product/service improvements making customers stickier? |
By mastering these metrics, you shift from simply reacting to churn to proactively understanding the story your customer data is telling you.
Powerful Methods for Churn Analysis
Okay, you've got your core churn metrics nailed down. Now, let's get to the interesting part: using that data to figure out the why behind the numbers. This is where real customer churn analysis begins. It’s about more than just tracking rates; it’s about using specific analytical techniques to find the hidden stories in your data.
Think of these methods as different lenses for your camera. Each one gives you a unique perspective on why customers are leaving and, more importantly, who might be next. We'll start with the basics and work our way up to the more advanced stuff, kind of like moving from a magnifying glass to a high-powered microscope.
Uncovering Trends with Cohort Analysis
The simplest, and honestly one of the most powerful, tools you have is Cohort Analysis. A "cohort" is just a fancy word for a group of customers who share a common starting point, usually their sign-up month. So, everyone who joined your service in January 2024 is one cohort.
By tracking each cohort’s retention over time, you can see if you're actually getting better at keeping customers. Did the January cohort stick around longer than the February one? If you pushed a big product update in February, this analysis gives you a direct signal about its impact. It cuts through the noise of your overall numbers and tells you if your product and onboarding are truly improving.
Identifying High-Risk Groups with Customer Segmentation
While cohorts group users by when they started, Customer Segmentation groups them by who they are or what they do. This is where you connect the dots between a customer's profile and their likelihood to churn. It's how you stop treating everyone the same and start getting specific.
You can slice and dice your customer base in countless ways:
- By Plan Type: Are customers on your "Basic" plan churning out faster than your "Pro" users? That might mean your entry-level plan isn't delivering enough value.
- By Feature Adoption: Are people who never touch your reporting dashboard more likely to leave? This is a huge red flag that you need to improve feature discovery or education.
- By User Demographics: Do customers from a certain industry or company size have terrible retention? You might have a product-market fit problem with that segment.
A bad customer experience is a massive driver of churn, and segmentation shows you exactly where things are breaking down. In fact, research shows that 73% of consumers will jump to a competitor after a few bad interactions—some will even leave after just one. By finding the segments with low engagement, you can step in and fix their problems before they walk away.
Predicting Timelines with Survival Analysis
Survival Analysis takes your churn analysis to the next level. Instead of just asking if a customer churned, it focuses on when they are most likely to do so. This statistical method, which got its start in medical research for predicting patient outcomes, is incredibly useful for understanding customer lifecycles.
Survival analysis helps answer the critical question: "At what point in the customer journey is the risk of churn highest?" Is it in the first 7 days? After 90 days? Or a year after a price increase?
Knowing this lets you time your retention efforts for maximum impact. If your analysis shows a churn danger zone between days 14 and 21, you can trigger an automated check-in email or an in-app guide on day 12. You're reinforcing value right when they need that nudge the most.
Forecasting Churn with Predictive Modeling
Finally, we arrive at the most advanced frontier: Predictive Modeling. This is where you use machine learning to dig through all your historical customer data—login frequency, feature usage, support tickets, you name it—to build a model that can forecast the churn risk for every single customer.
Instead of looking at groups, you’re now generating a specific "churn score" for each user. This is a game-changer. It allows your customer success teams to stop guessing and start focusing their energy with surgical precision on high-value accounts that are at the highest risk. If you're looking to build this kind of responsive system, mastering real-time data analytics is essential for getting the timely insights you need.
Building these models from scratch can be a heavy lift, but modern tools are making it far more achievable. You can get a much deeper look at how this all works in our guide to customer churn prediction. The end goal here is to create an early warning system that flags a customer at risk long before they even think about canceling, giving you a real chance to step in and save the account.
A Step-By-Step Churn Analysis Workflow
Digging into a customer churn analysis can feel like you’re about to embark on a massive data science expedition. But it doesn't have to be that complicated. If you break it down into a clear, manageable workflow, any team can get from raw data to real, actionable insights.
Think of this less as a one-time report and more as a repeatable system for continuously understanding—and improving—how well you keep your customers. It's all about asking the right questions, gathering the right evidence, and then using that evidence to make smarter decisions.
Phase 1: Define Your Objective and Scope
Before you pull a single row of data, you need to know what you're looking for. A vague goal like "let's understand churn" is a recipe for a shallow analysis that goes nowhere. You have to start with a specific, answerable question.
This initial question is your compass. It sets the scope for the entire project, telling you what data you'll need, which methods to use, and how you’ll know if you've succeeded.
Here are a few examples of strong, focused objectives:
- Pinpoint Onboarding Drop-off: "What percentage of new users churn within their first 30 days, and which specific onboarding steps are they skipping?"
- Identify At-Risk Segments: "Do customers on our 'Basic' plan churn at a higher rate than 'Pro' customers? What's the dollar impact of that difference?"
- Validate a Feature's Impact: "Did the cohort of users who signed up after we launched our new reporting dashboard stick around longer than the cohorts before it?"
A sharp objective like one of these keeps you on track and prevents you from getting lost in a sea of irrelevant data.
Phase 2: Gather and Prepare Your Data
With a clear objective in hand, you now know exactly what data to hunt for. A solid customer churn analysis usually requires pulling information from a few different places and stitching it together into one clean dataset.
Think of it like gathering all the puzzle pieces from different boxes before you can see the big picture. Your main sources will likely be:
- Subscription & Billing Data: This is your financial source of truth, often from a system like Stripe. It has the hard facts: plan types, MRR, subscription start/end dates, and payment history. This tells you exactly when a customer officially churned.
- Product Usage Data: This is the behavioral data from your product analytics tools. It tracks what users are actually doing—or not doing. Think login frequency, adoption of key features, and time spent in the app.
- Customer Relationship Data: This comes from your CRM or support desk and provides context. It includes firmographics (like company size or industry) and the history of support interactions.
Once you have the data, you have to clean it up. That means standardizing date formats, getting rid of duplicates, and figuring out what to do with missing values. A clean, well-structured dataset is the non-negotiable foundation for any reliable analysis.
Phase 3: Analyze and Visualize the Findings
Now for the fun part. It’s time to apply the analytical methods we talked about earlier to your clean data. This is where you start connecting the dots and uncovering the "why" behind the numbers.
This simple flow shows how you can move from broad groups down to specific, individual predictions.
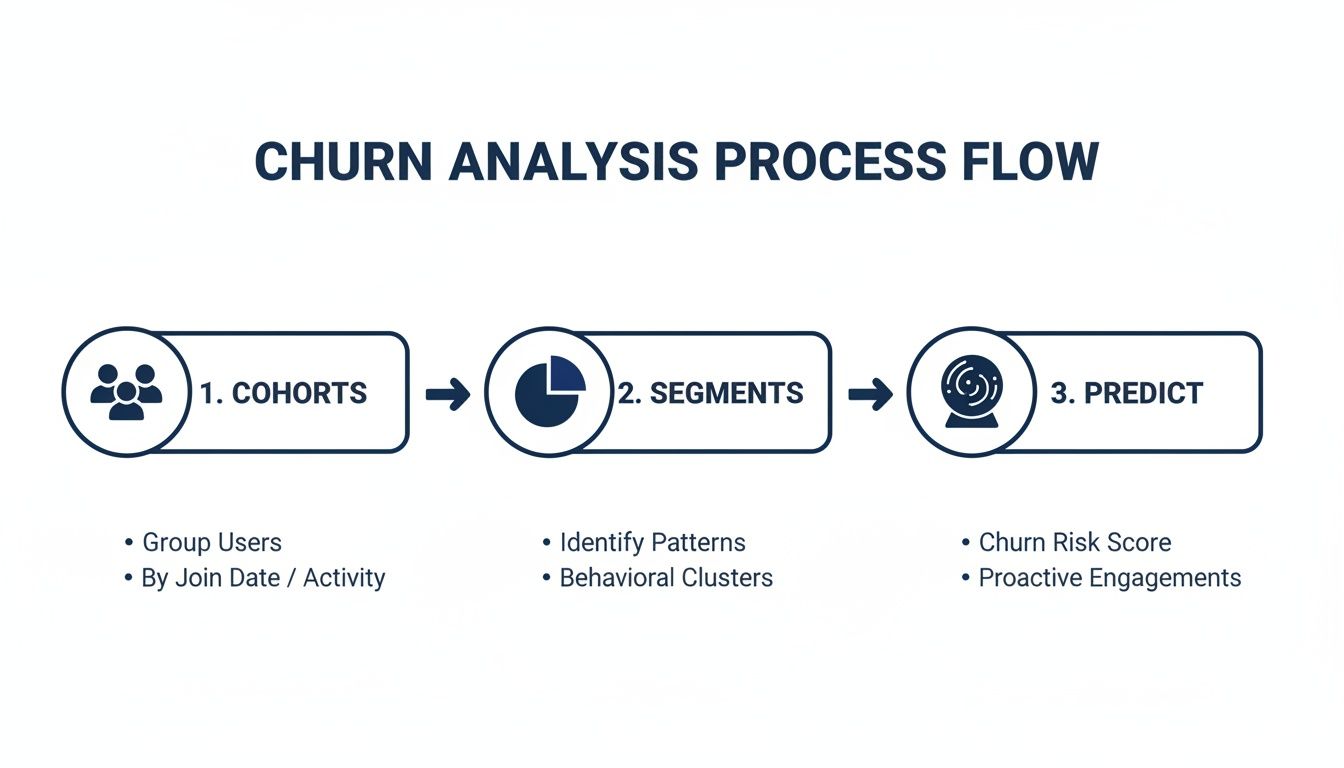
Starting with broad cohorts, then drilling into segments, and finally moving toward prediction gives your investigation a logical structure.
Begin with a high-level view. Use cohort analysis to spot trends over time. From there, dive deeper with segmentation to isolate the highest-risk groups. For instance, your analysis might reveal that small businesses in the retail sector who never adopt your "inventory management" feature have a shocking 75% churn rate within their first 90 days. Now that is a specific, actionable insight.
Key Takeaway: The goal here isn't just to make pretty charts. It's to tell a compelling story with data. Each graph should answer a piece of your original question, building a clear narrative about why your customers are leaving.
Phase 4: Prioritize and Act on Insights
This is where the rubber meets the road. An analysis is completely useless if it just sits in a dashboard. The final, most critical step is to turn your findings into concrete, prioritized actions and experiments.
A simple Impact vs. Effort framework is your best friend here. High-impact, low-effort initiatives should jump to the very top of your to-do list.
For example, if your analysis proves that users who don't get a welcome email are twice as likely to churn, a quick win is to set up an automated onboarding email sequence. It's a low-effort, direct response to a specific finding. From here, you can start building out entire retention playbooks designed to tackle each major churn driver you've uncovered, creating a systematic approach to keeping your customers happy and successful.
Turning Churn Insights Into Retention Plays
A solid customer churn analysis is more than just a slick report full of charts—it's a treasure map. It points directly to the biggest leaks in your customer bucket. But a map is useless if you don't actually follow it. This is where the real work begins: turning those data-driven findings into practical, revenue-saving actions.
The whole point is to move from simply observing a problem to actively intervening. You need a clear playbook that connects each specific churn signal you've found to a targeted retention strategy. Think of it as building a series of "if this happens, we do that" responses that become the engine of your retention efforts.
Building Your Retention Playbook
The idea here is pretty straightforward. For every major reason you find that customers are leaving, you design a specific "play" to counteract it. These aren't just random stabs in the dark; they're direct, logical responses to the problems your analysis has already highlighted for you. This approach keeps your efforts focused and efficient.
Let's see how this works in the real world:
IF your analysis shows a huge drop-off in the first 14 days from users who skipped the initial product tour…
THEN your retention play is to overhaul your onboarding. You could build a new interactive walkthrough, launch a welcome email series pointing out key features, or create a simple checklist to guide new users to that crucial "aha!" moment.
IF you discover that customers who never touch your "reporting" feature are 3x more likely to churn…
THEN your play is all about driving feature adoption. You might create an in-app prompt that pops up after a user's 5th login, suggesting they check out the reporting dashboard. Or, you could send a case study email showing how other customers get incredible value from that exact feature.
A retention play isn't a permanent, set-in-stone solution. It's a strategic experiment. Each one should be framed with a clear hypothesis, a measurable success metric, and a specific timeframe to see if it actually works.
Once you’ve identified the churn signals, a great next step is to explore a practical playbook on how to reduce customer churn effectively and build out your strategies.
The table below shows how you can connect common findings from a churn analysis directly to actionable retention plays.
Retention Playbook Examples Based on Churn Signals
| Churn Signal (The Finding) | Potential Root Cause | Sample Retention Playbook (The Action) |
|---|---|---|
| High churn among users who don't invite teammates in the first week. | They're not seeing the collaborative value; the product feels like a solo tool. | Launch an in-app prompt after 3 logins encouraging team invites. Offer a small feature unlock for inviting 2+ teammates. |
| Customers on the "Basic" plan churn at twice the rate of "Pro" plan users. | The Basic plan lacks a key sticky feature, or its limits are too restrictive. | Run an A/B test offering a 14-day free trial of a key "Pro" feature to a segment of "Basic" users. Analyze upgrade and retention rates. |
| A spike in cancellations follows every failed payment notification. | The dunning process is confusing, harsh, or doesn't provide easy ways to update payment info. | Revamp the dunning email sequence. Add a clear, one-click link to update credit card info directly in the email. |
| Usage drops significantly for accounts after 90 days. | Initial novelty has worn off; users aren't discovering advanced features. | Trigger a "Masterclass" email series at Day 75, showcasing advanced tips and power-user workflows to re-engage them. |
Each row provides a clear path from a data point to a concrete action, making it easier to prioritize your efforts and start experimenting.
Framing Interventions as Experiments
To make sure your plays are actually working, you absolutely have to treat them like scientific experiments. Guesswork will get you nowhere. Each intervention needs a clear success metric to tell you if it's moving the needle or just making noise.
For instance, if you're trying to fix a leaky onboarding process, your experiment could be structured like this:
- Hypothesis: By implementing a mandatory, interactive product tour for all new signups, we can increase the 30-day retention rate for new users.
- Action: Launch the new product tour to 50% of new users (the test group) while the other 50% gets the old experience (the control group).
- Success Metric: A statistically significant increase in the 30-day retention rate for the test group compared to the control group.
- Timeline: Run the experiment for 60 days to gather enough data for a confident result.
This disciplined approach allows you to validate your ideas with cold, hard data. You can quickly kill what doesn’t work and double down on the strategies that are proven to reduce churn. You can explore more detailed guidance on how to reduce customer churn with these experimental frameworks in mind.
Accelerating Action with AI-Powered Platforms
Let's be honest: manually identifying at-risk users and deploying all these plays can be slow and painful, especially for a small team. This is where AI-powered platforms can be a true game-changer. They automate the heavy lifting of both analysis and action.
Platforms like LowChurn are built to hook directly into your Stripe and product data, giving you real-time churn risk scores for every single customer.
The screenshot above shows how a dashboard can automatically surface at-risk accounts, turning a mountain of complex behavioral data into a simple, prioritized to-do list for your team. Instead of waiting for a quarterly report, you get an early-warning system that flags potential churn days or even weeks ahead of time. This gives you the chance to deploy personalized, automated retention plays—like a targeted email or a special offer—at the perfect moment to keep a customer from walking away.
Common Pitfalls in Churn Analysis
Running a churn analysis is one thing; getting results you can actually trust to make big decisions is another. It's surprisingly easy to fall into a few common traps that can completely derail your efforts, leading your strategy down a dead end. Steering clear of these is what separates a useful analysis from a useless one.
The most classic mistake? Confusing correlation with causation. You might notice that customers who never touch a certain feature churn at a higher rate. The obvious conclusion is to push that feature harder, right? But what if that feature is only useful for your most advanced power users? In that case, not using it isn't the cause of churn; it's a symptom of a customer who was never a great fit to begin with.
Misinterpreting Your Data and Metrics
Another easy way to get tripped up is by using a fuzzy definition of "churn" or by failing to slice your data correctly. A single, company-wide churn rate can be dangerously misleading. It might look healthy on the surface, while masking a five-alarm fire in your most valuable customer segment.
It also pays to sanity-check your numbers against the real world. Some industries just have higher turnover. In the United States, for example, the financial and cable industries hover around a 25% churn rate, while telecom is around 21%. If your analysis spits out a number that's wildly out of line with industry norms, it’s a good sign you should double-check your math or dig deeper into a potential market-level problem. You can get a better sense of this by looking into customer retention rates across industries.
The Overly Complex Model Trap
It's tempting to build a super-sophisticated, all-knowing predictive model. But more often than not, these complex models become "black boxes." They might be accurate, but if you can't explain to a product manager why the model thinks a customer is about to leave, how can they design an effective intervention?
Validation Check: Always gut-check your quantitative findings with qualitative feedback. Pull up customer exit surveys, read through recent support tickets, and talk to your sales team. If your data model points a finger at poor onboarding, your exit surveys should be telling a similar story. The two have to line up.
Start simple. A clear cohort analysis or a straightforward segmentation study that gives you one solid, actionable insight is infinitely more valuable than a complex model nobody understands. By keeping an eye out for these common mistakes, you can make sure your customer churn analysis actually drives growth, not just generates reports.
Your Churn Analysis Questions, Answered
As you start digging into customer churn, a few practical questions always seem to pop up. Let's tackle some of the most common ones to clear things up and help you get started.
What Is a Good Customer Churn Rate?
This is the million-dollar question, but the honest answer is: it depends. A "good" churn rate is completely relative to your industry, business model, and customer type. The real goal isn't to hit some magic number but to consistently trend your own churn rate downward over time.
That said, here are a few rough benchmarks to give you a sense of the landscape:
- For a B2C SaaS company, a monthly churn rate of 5-7% is pretty standard.
- But for an Enterprise B2B platform, that same 5-7% would be a five-alarm fire. They’re usually aiming for less than 1% monthly churn, thanks to bigger contracts and stickier products.
How Often Should We Run a Churn Analysis?
For most subscription businesses, a quarterly deep-dive is a great rhythm. This gives you enough data to spot meaningful trends without getting bogged down in daily noise.
Alongside that, you should be keeping a monthly pulse on your top-level metrics, like MRR Churn and Logo Churn. This way, you can catch any worrying spikes early and react before a small problem becomes a major one.
Think of it like this: regular analysis turns churn from a reactive fire-drill into a proactive, continuous part of how you do business. It's about always learning and always improving.
Can I Do This Without a Data Scientist?
Yes, you absolutely can. While a data scientist is invaluable for building complex predictive models, you don't need one to get started with the fundamentals.
Core techniques like cohort analysis and customer segmentation can be done right in a spreadsheet or with a standard business intelligence tool. And many modern analytics platforms are built to do a lot of the heavy lifting for you, making powerful analysis more accessible than ever.
Ready to turn churn analysis into automated action? LowChurn uses AI to predict which of your Stripe customers are at risk of churning and gives you the tools to save them. Stop guessing and start retaining.