If you've ever tried to apply a standard customer journey map b2b template to a SaaS business, you know it feels like trying to fit a square peg in a round hole. It just doesn't work. The old model treats the customer relationship as a straight line to a sale, but the reality of SaaS is a continuous loop of engagement, adoption, and renewal.
Why Old-School B2B Journey Maps Fall Short for SaaS
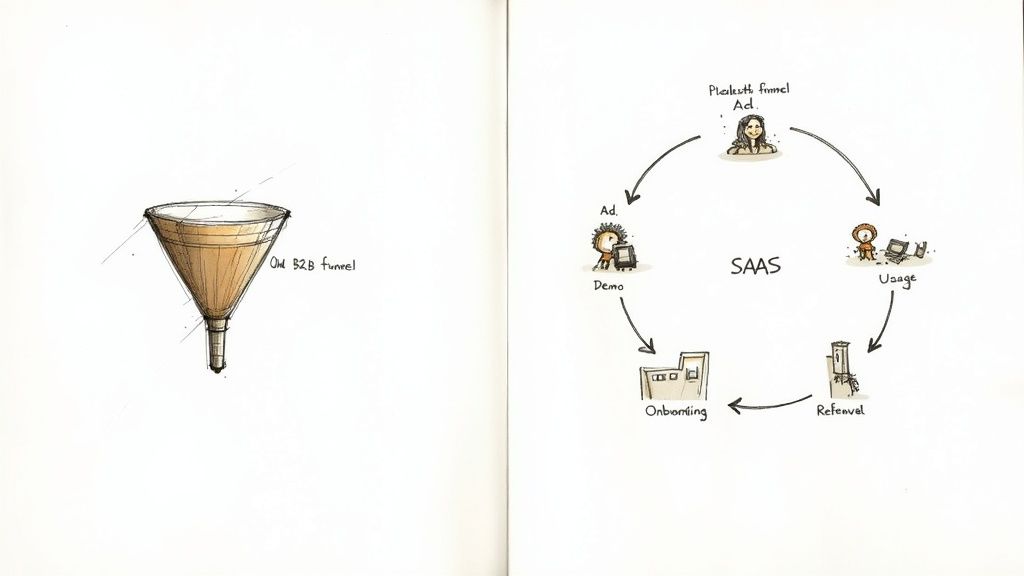
Let's be blunt: the traditional B2B sales funnel is a relic in the subscription economy. It was built for a world of one-time transactions where closing the deal was the finish line. In SaaS, that initial "yes" is just the starting gun.
Our success isn't measured by a single purchase. It’s defined by long-term retention, account expansion, and turning happy users into vocal advocates. This massive difference in business models means a simple, linear map will always miss the bigger picture.
The real goal isn't just to acquire a customer; it's to create a successful user who becomes a long-term advocate. An outdated map that stops at "purchase" ignores the most critical revenue-generating stages of the SaaS lifecycle.
The Chaos of a Non-Linear Path
The journey of a modern B2B SaaS customer is anything but a straight line. Think about it. A team might kick off a free trial, invite a few colleagues, ask a support chatbot a question, join a product webinar, and have a call with sales—all before swiping a credit card.
We're seeing buyers interact with more than 10 different touchpoints on average, weaving together digital self-service with direct human interaction. You can learn more about these multi-touch journeys on coveo.com.
This process isn't a neat sequence. It's a tangled web of looping behaviors and influences:
- You're Selling to a Committee: You aren’t selling to an individual. You have the economic buyer who cares about ROI, the end-user who needs the features to work, and the IT admin who worries about security. A linear map can't possibly track these parallel, often conflicting, experiences.
- The Real Work Starts Post-Sale: For SaaS, the most important moments happen after the initial payment. A clunky onboarding, poor feature adoption, or slow support can kill a renewal before it even comes up.
- Value is Always Being Judged: Unlike buying a piece of hardware, SaaS customers constantly re-evaluate your product's worth. Every login, every support ticket, and every new feature release is a micro-touchpoint that reinforces—or erodes—their decision to stick around.
The differences are stark when you compare the old way of thinking with what's required for SaaS today.
Traditional Funnel vs. SaaS B2B Journey Map
| Attribute | Traditional B2B Funnel | Modern SaaS Journey Map |
|---|---|---|
| Focus | Acquiring new leads and closing a single deal. | Retaining customers and maximizing lifetime value. |
| Structure | Linear (Awareness > Interest > Decision > Action). | Cyclical and non-linear (Adoption > Retention > Expansion > Advocacy). |
| End Goal | The initial purchase. | The renewal, upsell, and customer referral. |
| Key Metrics | MQLs, SQLs, Conversion Rate, Deal Size. | Activation Rate, Churn, Net Revenue Retention (NRR), LTV. |
| Scope | Primarily focuses on pre-sale marketing and sales activities. | Encompasses the entire customer lifecycle, from first touch to churn/advocacy. |
This table shows why we need to move on. The old funnel is a sales tool; the modern journey map is a company-wide retention and growth strategy.
It's All About the Full Lifecycle
A truly effective customer journey map b2b for a SaaS business must be built around the entire customer lifecycle, not just the sales cycle. This gives you a complete, 360-degree view of the customer's experience, from the moment they see your ad to their tenth renewal conversation.
Understanding this complete path is a foundational piece of customer lifecycle management.
When you map the whole lifecycle, you finally see what actually matters for retention. You pinpoint where users get stuck in onboarding, which features go untouched, and what events trigger them to reach out for help. These insights are pure gold—they show you exactly where to focus your efforts to boost growth and slash churn. Your map transforms from a static diagram into an actionable playbook for the entire business.
Laying the Groundwork: Realistic Personas and Lifecycle Stages
Before you can map anything, you have to know exactly who you’re mapping for. A generic persona like "Marketing Manager" just won't cut it. A powerful customer journey map b2b is built on the backs of realistic, data-driven personas that reflect the different players in a complicated B2B buying decision.
You're not selling to one person; you’re selling to a committee. Each member has their own motivations, goals, and headaches. Your map needs to capture these distinct points of view to be worth the effort.
Define Your Cast of Characters
First things first, you need to identify the key players in a typical deal. While their job titles might change from company to company, their roles are often surprisingly consistent. Dive into your CRM data, sales call notes, and customer interview transcripts to find evidence of these archetypes.
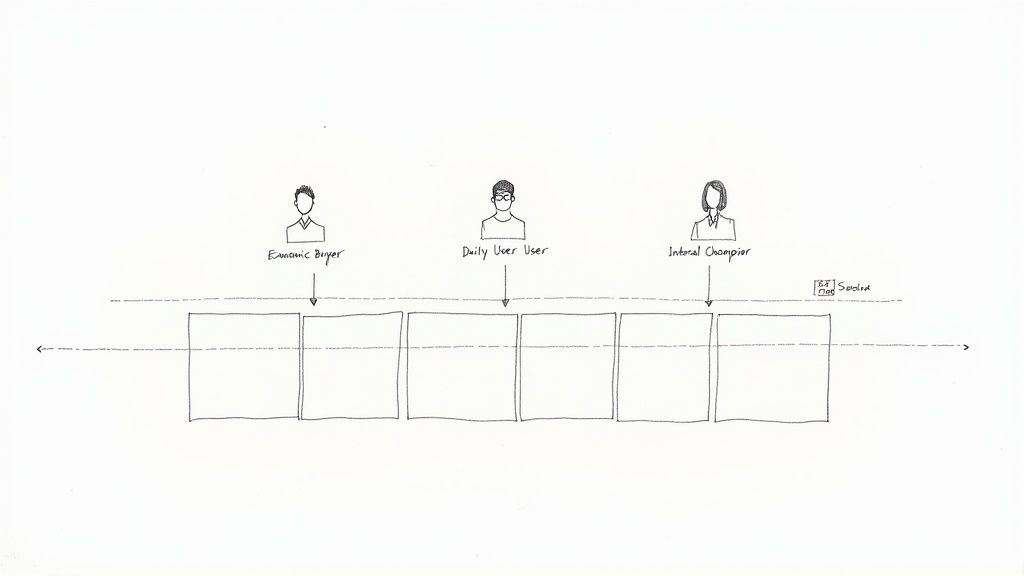
You'll almost always run into these three core personas in a SaaS sale:
- The Economic Buyer: This is who signs the checks—often a C-level exec or department head. Their world revolves around ROI. They want to know, "How will this cut costs or drive revenue?" and "What's the real total cost of ownership here?"
- The Daily User: This is the person who will be in your product all day, every day. They're focused on usability and efficiency. Their questions are all about features, how intuitive the interface is, and whether it will genuinely make their job less painful.
- The Internal Champion: Think of this person as your inside advocate. They get what you're offering and go to bat for you to convince the rest of the team. To succeed, they need compelling data and solid case studies to build their business case and navigate the maze of internal politics.
A journey map that only follows one persona is destined to fail. The real insight comes from understanding how these individual paths cross. For example, when a Daily User's frustration with a competitor's tool gives your Internal Champion the exact ammo they need to persuade the Economic Buyer.
When you segment your audience this way, you get past flimsy demographics and start mapping the actual human dynamics that drive a B2B deal forward.
Outline the Core SaaS Lifecycle Stages
With your personas fleshed out, it's time to build the framework for their journey. For SaaS businesses, this is so much more than a simple sales funnel. We need a lifecycle model that covers the entire relationship, from the moment someone hears your name to the day they become a raving fan.
Each of these stages represents a critical point where your customer's goals and needs change entirely.
- Awareness: A potential customer realizes they have a problem and starts looking for answers. They're thinking, "How can I fix this business pain?"
- Consideration: The buying committee starts seriously evaluating vendors, stacking up features, pricing, and reviews side-by-side. Their core question is, "Which of these options is the best fit for what we actually need?"
- Decision: The final choice is made, contracts get signed, and the deal is done. The conversation shifts to security protocols, legal reviews, and implementation timelines.
- Onboarding: Your new customer gets their hands on the product for the first time. Their only goal is to get from zero to value as quickly as possible. They’re asking, "How do I get this thing working?"
- Adoption: The team starts weaving your tool into its daily routines. Success at this stage means driving deep engagement and making sure they're getting the full value they paid for.
- Advocacy: This is the finish line. A happy customer renews, expands their usage, and tells their network about you. This stage is earned by delivering an exceptional experience throughout the entire journey.
This six-stage framework creates the essential scaffolding for your map. It forces you to think beyond just closing the deal and focus on building a successful, long-term partnership. With your personas and stages locked in, you have the two core components you need to start gathering data and plotting the journey.
Finding the Data That Actually Matters
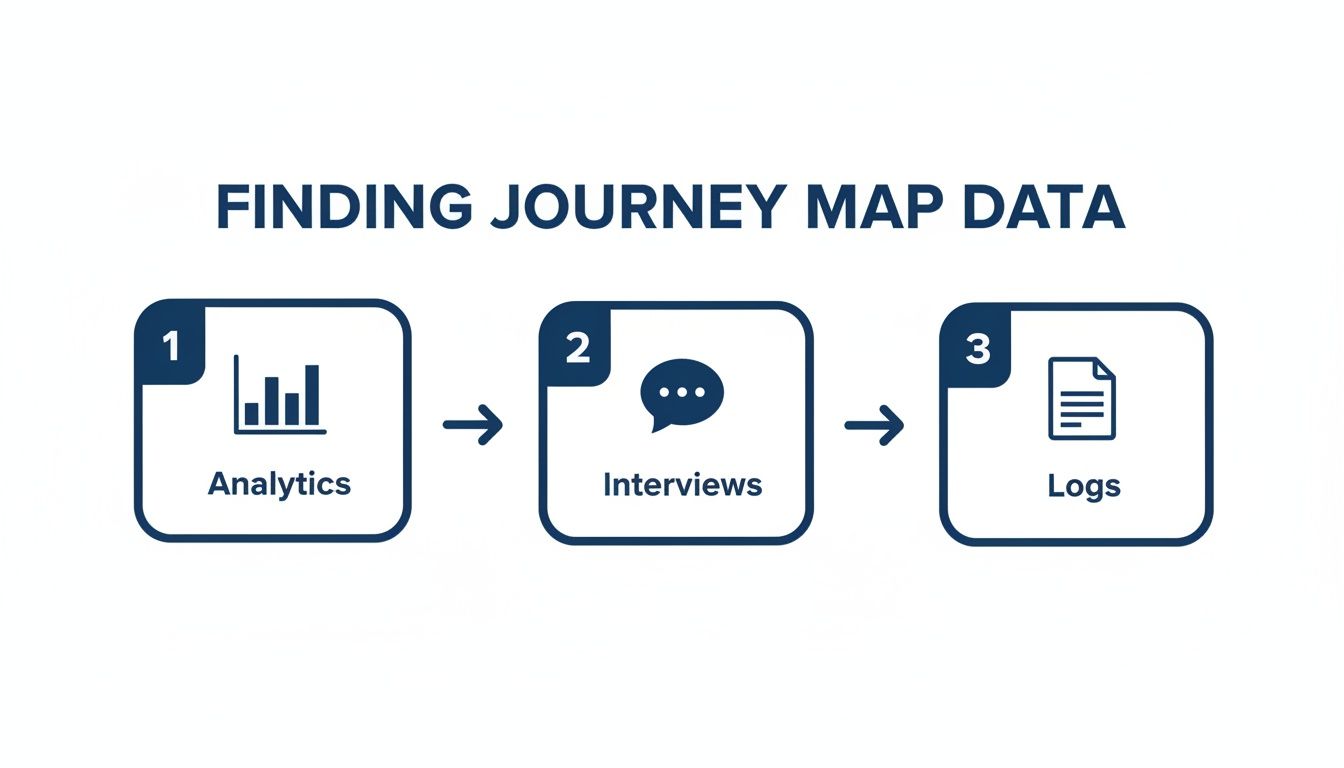
An effective customer journey map isn't built on guesswork; it's built on a foundation of solid evidence. To get this right, you have to become a bit of a data detective, blending the hard numbers with real human stories. This is how you uncover not just what your customers are doing, but why they're doing it.
Assumptions are the enemy here. If you rely on them, you'll end up with a map that looks great in a presentation but does nothing to fix the real friction points causing frustration and, ultimately, churn. The key is to gather a balanced mix of quantitative and qualitative data.
The Hard Numbers: What Your Customers Are Doing
Quantitative data gives you the scalable, objective truth about user behavior. It's the evidence that points you in the right direction, showing you exactly where you need to start digging deeper. Honestly, your most valuable sources are probably sitting right under your nose in the tools you use every day.
- Product Usage Analytics: This is your goldmine. Metrics like feature adoption rates, session duration, and daily active users show you precisely how accounts are engaging with your platform. A sudden drop-off in logins from a key account? That's a huge red flag you can't ignore.
- Billing and Subscription Signals: Your payment system (like Stripe) is so much more than a transaction log. It’s a rich source of journey data. Keep an eye out for signals like plan upgrades or downgrades, failed payments, and credit card expiration warnings. These are pivotal moments in the customer lifecycle.
- CRM and Support Data: Dig into the volume and type of support tickets. If you see a sudden spike in tickets about a specific feature right after a release, you know something isn't landing right. This data helps you connect the dots between product usage and customer frustration.
These numbers are the building blocks for creating a dynamic picture of account health. In fact, many of these same metrics are essential for calculating an accurate customer health score, which is a non-negotiable part of any serious retention strategy.
Think of quantitative data as the "what." It can show you that 25% of new users never invite a single team member, but it can't tell you why. For that, you need to hear from them directly.
The Human Story: Uncovering the "Why"
While numbers show you what’s happening, qualitative data tells you the story behind those numbers. This is where you find the emotional context—the frustrations, the confusion, and the "aha!" moments that analytics simply can't capture. It's how you truly begin to understand the customer experience.
Getting this information is simple, but not always easy: you have to talk to people and really listen.
Where to Find the Best Qualitative Insights
- Targeted Customer Interviews: Don't just cherry-pick your happiest advocates. Make a point to talk to users who recently downgraded or whose product usage has tapered off. Ask open-ended questions like, "Can you walk me through the last time you tried to do X in our app?" This gets you the unvarnished truth.
- NPS and CSAT Comments: The score itself is a good starting point, but the gold is in the verbatim comments. A Net Promoter Score of 7 is just a number. But a comment that says, "The product is great, but your billing page is a nightmare to navigate," gives you a concrete problem to go fix.
- Support Chat Logs and Call Recordings: This is raw, unfiltered, in-the-moment feedback. Spend some time reading through support transcripts to spot recurring questions or points of confusion. You’ll hear the customer's exact phrasing, which is invaluable for seeing things from their perspective.
Modern B2B journey mapping has moved beyond static flowcharts. It's now a continuous, analytics-driven process. The most successful teams integrate multiple data streams—from product analytics to support logs—to build a map that reflects both behavior and motivation. To see how this plays out in the real world, you can discover more insights about tying B2B journey mapping to business outcomes on linkgraph.com.
By weaving these two types of data together, your journey map transforms from a simple diagram into a rich, three-dimensional view of your customer's world. This holistic approach lets you pinpoint a problem with numbers (like low adoption of a key feature) and then understand the root cause through direct feedback (like customers saying the setup process is just too confusing).
Mapping Touchpoints, Emotions, and Hidden Friction
Alright, you've got your personas and a pile of data. Now for the fun part: bringing your customer journey map b2b to life. This is where we stop looking at spreadsheets and start telling a story—a visual story of every single interaction a customer has with your business.
This isn't just about listing steps. It's about getting under the skin of the experience and understanding the emotional highs and lows that come with it.
You have to trace every single step, from the first time a prospect sees your ad to their tenth conversation with your customer success team. Why? Because a breakdown at any one of those points can put the whole relationship at risk. A smooth, connected experience isn’t just a nice-to-have anymore; it's what customers expect.
It’s no secret that B2B buying has gone digital. Analysts predict that nearly 80% of B2B sales interactions now happen through digital channels. That’s precisely why this mapping process is so vital—it helps you smooth out the handoffs between your website, your sales reps, and your product itself. For anyone looking to dig deeper into this, ClearlyRated has some great insights on improving digital buying experiences.
Plotting Every Interaction
Let's start by cataloging every touchpoint across the lifecycle stages you already defined. A touchpoint is any moment a customer comes into contact with your company, brand, product, or team. It’s tempting to only focus on the big, obvious moments like a sales demo, but trust me, the real friction often hides in the small, seemingly insignificant interactions.
You need to be exhaustive here. Think about both the direct and indirect ways customers engage:
- Marketing Touchpoints: That blog post they found on Google, the social media ad they scrolled past, the webinar they attended, or the case study that convinced them.
- Sales Touchpoints: The initial discovery call, the product demo, the back-and-forth on a proposal, and the final contract negotiation.
- Product Touchpoints: The signup flow, that very first login, every feature they click on, and the in-app notifications they receive.
- Support Touchpoints: When they submit a support ticket, read a help doc, or get frustrated with a chatbot.
The goal is to blend different data sources—analytics, interviews, system logs—to see the full picture.
When you combine these sources, you move beyond just knowing what customers do and start to understand the context and motivation behind their actions.
Going Deeper Than Actions
This next part is what separates a decent map from a game-changing one. You absolutely have to map the customer’s internal state at each touchpoint. For every interaction you've listed, gather your team and ask these three questions:
- What is the customer thinking? What questions are running through their head? What are they trying to figure out?
- How are they feeling? Are they excited and optimistic? Or are they confused, anxious, or just plain frustrated?
- What are their pain points? Where is the friction? What’s making their job harder than it should be?
This emotional layer is what turns a simple diagram into a powerful empathy-building tool. It’s about forcing yourself to see your own company from the outside-in.
A map without emotions is just a process flow. The real gold is in understanding the highs and lows—the moments of delight that create champions and the points of friction that silently push customers out the door.
A Real-World SaaS Scenario
Let's make this tangible. Imagine your "Daily User" persona is in the Onboarding stage. You've identified a critical touchpoint: "Configure critical integration with their CRM."
Your product analytics (the quantitative data) show that a whopping 40% of new users drop off at this step and never complete it. That's the "what." Now, you turn to your support tickets and user interview notes (the qualitative data) to find the "why."
Here’s how you could map it out:
| Touchpoint | Customer Action | Customer Thoughts | Customer Feelings | Friction Point |
|---|---|---|---|---|
| Configure CRM Integration | Clicks "Connect," is redirected to an authentication screen. | "Okay, this should be simple enough. I just need to log in." | Hopeful, Optimistic | |
| Authentication Fails | Enters credentials, but receives a vague error message. | "Did I type my password wrong? What does 'Error 401' mean?" | Confused, Frustrated | Unclear error message. |
| Searches Help Docs | Looks for a help article on the error. | "The documentation is too technical. It’s written for developers." | Overwhelmed, Annoyed | Documentation is not user-friendly. |
| Abandons Task | Gives up and moves on to other tasks, leaving the integration incomplete. | "I'll deal with this later. It's not worth the headache right now." | Defeated, Disappointed | Value is not realized. |
Boom. Suddenly, you have a crystal-clear picture of a major problem. The issue isn't the integration itself; it’s the terrible user experience surrounding it. You've identified specific, fixable friction points—the cryptic error message and the jargon-filled help docs—that are killing adoption and putting brand-new customers on the fast track to churn. This is the kind of actionable insight that makes your customer journey map b2b one of the most valuable tools in your growth arsenal.
Translating Insights Into Retention Playbooks
Let's be honest. A beautiful, detailed map is just a pretty picture if it's just hanging on a wall. Its real job is to help you get somewhere. The exact same thing is true for your customer journey map b2b—it’s not meant to be a static document. Its entire purpose is to drive specific, measurable actions that actually improve your business.
This is where the rubber meets the road. You’re about to turn all those carefully plotted friction points and emotional insights into concrete strategies that keep customers around. It’s the critical shift from analysis to action, connecting your map directly to real-world outcomes like lower churn and higher customer lifetime value.
Prioritizing Your Fixes
After mapping everything out, you’ve probably got a long list of things to improve. It can be overwhelming. But trying to tackle everything at once is a surefire way to get nothing done. You have to be ruthless about prioritizing.
Focus your energy where it will make the biggest difference. The best way I've found to do this is to evaluate each friction point against two simple questions:
- How big is the churn risk? Seriously, how likely is this specific problem to make someone cancel? A confusing error message that blocks a critical workflow is a five-alarm fire. A typo on a marketing page? Not so much.
- Who does this affect most? Does this issue hit your highest-value customers the hardest? Fixing a major pain point for your enterprise clients will deliver a much better return than solving a minor annoyance for your free-tier users.
By scoring each issue on these two axes—churn impact and customer value—you’ll quickly see which handful of problems demand your immediate attention. These are your starting points for building powerful retention playbooks.
Building Data-Driven Retention Playbooks
So, what’s a retention playbook? It's just a pre-defined set of actions your team takes when a specific customer behavior or data trigger pops up. Your journey map gives you the "why" a customer might be struggling, and your data gives you the "when." Put them together, and you can shift from putting out fires to preventing them in the first place.
The goal here is to automate your response to the early warning signs you uncovered on your map. You’re essentially building a system that triggers an action before a customer gets frustrated enough to start shopping for alternatives. If you need a jumpstart, checking out different customer success plan templates can provide a solid framework for how to structure these.
A great playbook doesn't wait for a customer to complain. It uses data to anticipate their needs and intervenes with the right help, at the right moment, turning a potential point of friction into a moment of delight.
Sample Retention Playbook Triggers
Let's make this tangible. Imagine your journey map helped you pinpoint the following issues. Here’s how you could build automated playbooks to get ahead of them.
This table shows a few examples of how to connect the dots from a problem you found on your map to a data trigger and, finally, to a specific, proactive action.
| Friction Point (Identified on Map) | Data Trigger | Retention Playbook Action |
|---|---|---|
| User Confusion During Onboarding | A new user fails to complete a key setup step (e.g., inviting a teammate) within 48 hours of signing up. | Automatically trigger a personalized email from a customer success manager offering a quick 15-minute onboarding call. |
| Post-Trial Engagement Drop | A recently converted account shows a 50% drop in daily logins during the first 30 days post-trial. | Create a task in the CRM for the account owner to reach out, share a relevant case study, and check if they need help. |
| Low Adoption of a "Sticky" Feature | A team has been active for 60+ days but has never used a core feature known to reduce churn. | Trigger an in-app guide or a short video tutorial highlighting the benefits of that specific feature the next time they log in. |
Notice how these playbooks aren't based on guesswork. Each one is a direct response to a specific point of friction that you've already validated through your mapping process.
This data-driven approach means your team spends its time on activities that are actually proven to prevent churn and protect revenue. It transforms your map from a nice-to-have document into the living, breathing engine of your entire retention strategy.
Measuring Success and Keeping Your Map Relevant
Building out a detailed B2B customer journey map feels like a huge win, and it is—but it's not the end of the road. Think of your map as a living, breathing guide, not a static artifact you frame and hang on the wall. Its real power is unlocked when you start measuring its impact and commit to keeping it current as your product, market, and customers inevitably change.
Without tracking the right numbers, your map is just a collection of really good ideas. To get buy-in and justify the time you've invested, you have to prove that the changes you're making—based on the map's insights—are actually improving revenue and retention.
KPIs That Prove Your Map Is Making an Impact
To see if your journey mapping work is actually paying off, you first need to know where you're starting. Establish a clear baseline for your most important business metrics before you roll out any changes. Once you have that benchmark, you can track the improvements and draw a straight line from your efforts to tangible results.
For a SaaS business, these are the metrics that truly matter:
- Net Revenue Retention (NRR): This is the big one. NRR tells you how much revenue you're keeping (and growing) from your existing customers, accounting for everything from upgrades and expansions to downgrades and churn. If your NRR is climbing, it’s a strong sign that you’re successfully smoothing out the customer experience.
- Customer Churn Rate: The classic retention metric. You’ll want to track both logo churn (how many customers you lose) and revenue churn (how much MRR you lose). Comparing these figures before and after you implement changes from your map will give you a black-and-white picture of what's working.
- Stage-Specific Conversion Rates: Don't get lost in the big-picture numbers alone. Zoom in on the micro-conversions at critical moments in the journey. For instance, what’s your trial-to-paid conversion rate? Or your onboarding completion rate? Improving these tells you you’re fixing problems right at the source.
A journey map isn't a one-and-done project; it’s a compass. Its value comes from using it to guide your decisions and then checking to see if you're still heading in the right direction. If you're not measuring, you're just guessing.
A Simple Framework for Keeping Your Map Fresh
Things change fast. Your product gets new features, customer expectations evolve, and your market shifts. A map that’s even six months old can quickly become dangerously out of date. To avoid this, you just need a simple, repeatable process for keeping it fresh.
I recommend a quarterly check-up. This regular review rhythm ensures your map stays the single source of truth for the customer experience across your entire company.
- Set a Quarterly Review: Get the same cross-functional team that built the map together every three months. Put it on the calendar as a recurring, can’t-miss event.
- Bring New Data to the Table: Before each meeting, pull in the latest intelligence. This means fresh notes from customer interviews, recent NPS feedback, product usage data from the last 90 days, and any new insights from your sales and support teams.
- Account for Product Updates: Did you launch a major feature? Revamp your pricing? Your map needs to reflect that. Add new touchpoints, adjust existing ones, and consider how these changes impact the customer’s path.
- Revalidate and Share: As a team, walk through the updated map. Does it still feel right? Does it match what you’re hearing from customers? Once everyone agrees, share the new version far and wide so the entire organization is working from the most current playbook.
This disciplined approach transforms your journey map from a snapshot in time into a dynamic tool that grows right alongside your business, constantly fueling a more customer-centric culture.
Are you tired of guessing which customers are about to churn? LowChurn is an AI-powered platform that analyzes product usage and Stripe subscription data to predict churn risks 7-30 days in advance. Get the early-warning system and actionable playbooks you need to protect your MRR. Stop churn before it happens by visiting https://www.lowchurn.com.